Graphics Programs Reference
In-Depth Information
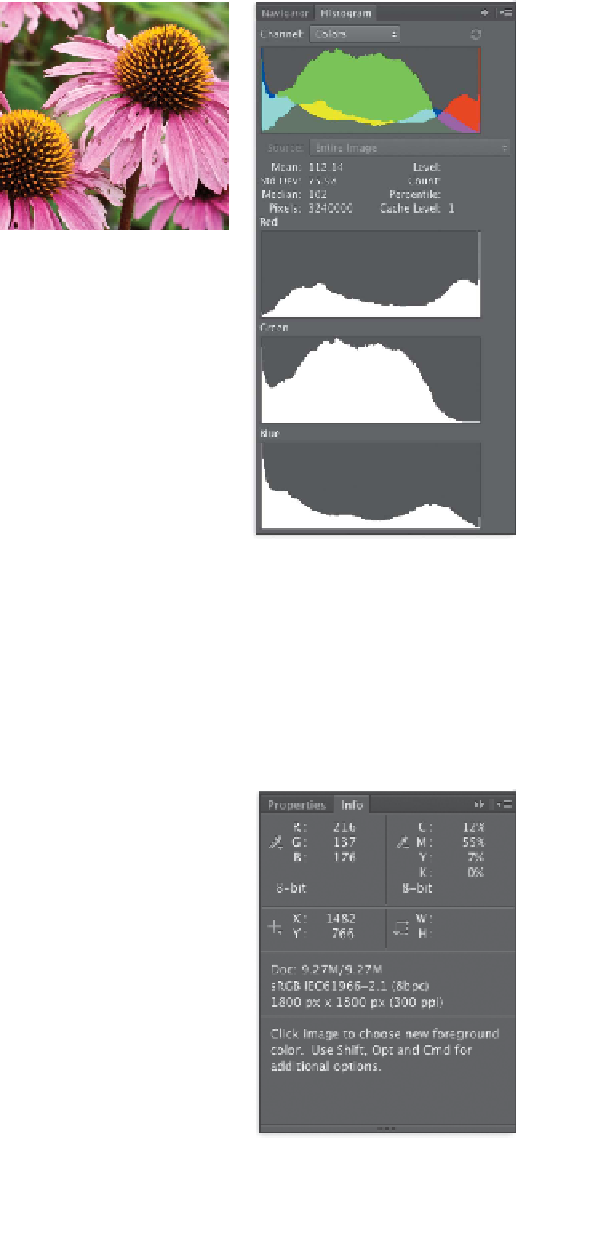
Histogram
When you are color correcting or
adjusting exposure, the histogram
can be a great help. This graph
illustrates how the pixels in the image
are distributed across brightness
levels. To read a histogram, start
at the left edge, which shows the
shadow regions. The middle shows
the midtones (where most adjustments to an image are made), and
to the right are the highlights. Image touchup and enhancement
are covered in Chapter 10. You may want to leave the Histogram
panel open as you work, because it is an easy way to learn to read
the graphical details of a digital image.
Info
The Info panel is a useful place to find a plethora of image infor-
mation, even when you're using the default options. You can get
information about color values as well as precise details about the
active tool. However, by customizing the panel you can make it
truly useful.
The Histogram panel has been set
to Show All Channels view (click the
triangle in the upper-right corner and
choose All Channels view). The top
histogram is a composite histogram
for the Red, Green, and Blue channels
combined; the next three show them
individually.
1.
Select the Info panel by choosing Window > Info or by press-
ing F8.
2.
From the Info panel submenu (the triangle in the upper-right
corner) choose Panel Options.
3.
The resulting dialog box has several options; I recommend the
following choices for a new user:
•
Leave Mode set to Actual Color.
•
Set Second Color Readout to CMYK if you're doing print
work, or set it to RGB color if you are preparing images to
use on the Internet or in video exclusively.
•
Set Mouse Coordinates to Pixels.
•
Enable the following choices under Status Information: Doc-
ument Sizes, Document Profile, and Document Dimensions.
•
The last option, Show Tool Hints, provides a detailed
explanation for each tool you select from the Tools panel.
4.
Click OK.