HTML and CSS Reference
In-Depth Information
Figure 10-34
Google chrome developer tools pane
tools button
developer t
o
ols pane
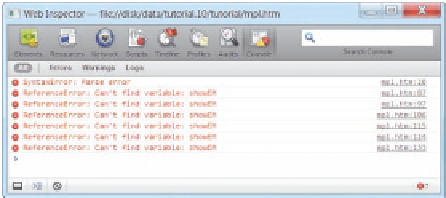
Safari for Windows also contains developer tools in its Web Inspector window. To
view the Web Inspector window, click the Menu icon in the upper-right corner of the
browser window and then click Develop and Show Error Console. With Safari for the
Macintosh, you first have to enable the Safari Develop menu by clicking Safari, click-
ing Preferences, and then within the Advanced tab checking Show Develop menu in the
menu bar. Once the menu is enabled, you click the Show Error Console button to view
any JavaScript errors in your code. Figure 10-35 shows the errors listed in the Console
tab of the Web Inspector window.
Figure 10-35
safari Web inspector window
Error Console button