HTML and CSS Reference
In-Depth Information
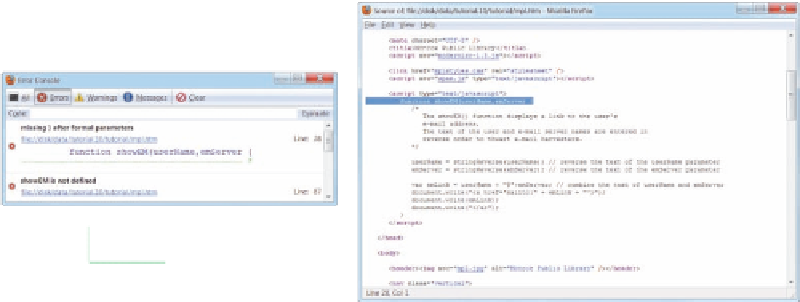
Firefox provides the Firefox Error Console shown in Figure 10-33, which displays
all of the errors generated within the current document. To view the console, click
Web Developer and Error Console from the Tools menu. Within the Error Console is an
Evaluate box in which you can insert JavaScript commands to evaluate your code and
variable values at the point at which the error occurred.
Figure 10-33
Firefox error console and document source window
document source window
Error Console
click to view the
document source and
location of the error
To view the developer tools under Google Chrome, you click the Customize and con-
trol button located in the upper-right corner of the browser window, click Tools, and then
click Developer Tools. As Figure 10-34 shows, Chrome opens a pane at the bottom of the
browser window that contains tools to work with the document, the style sheets, and any
JavaScript programs.
Most browsers also
provide an error console
or developer tools window
to display syntax errors
from your CSS style sheet
or warnings generated
by syntax mistakes in the
HTML code.