Hardware Reference
In-Depth Information
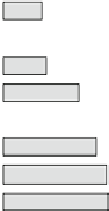
Table 3.6
Relationship of F/Fs and pipeline stages
Pointer
FF0
FF1
FF2
0
E2
E4
E3
1
E3
E2
E4
2
E4
E3
E2
SH-3
1.00
60
1.00
SH-4
Compiler + Porting
1.10
1.10
146
1.27
255
+ Harvard
1.91
1.49
2.24
298
+ Superscalar
+ BO type
1.59
2.39
319
+ Early branch
1.77
2.65
354
+ 0-cycle MOV
1.81
2.71
361
SH-X
Compiler + Porting
1.80
2.70
504
504
+ Superpipeline
1.47
3.07
584
584
+ Branch prediction
1.50
3.16
602
602
1.60
3.37
642
642
+ Out-of-order branch
+ Store Buffer
1.69
3.55
677
677
+ Delayed execution
1.80
3.78
720
720
0
0.5
1.0 1.5
0123
Architectural
performance
0
200 400 600
Performance
(MIPS)
Cycle Performance
(MIPS/MHz)
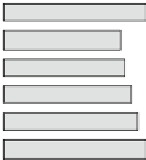
Fig. 3.16
Performance improvement of SH-4 and SH-X
pointer indexes zero again and the FF0 holds a new input value. This method is good
for a short latency operation in a long pipeline. The power of pipeline F/Fs decreases
to 1/3 for transfer instructions and decreases by an average of 25% as measured using
Dhrystone 2.1.
3.1.3.5
Performance Evaluations
The SH-X performance was measured using the Dhrystone benchmark as the SH-4
was. The popular version was changed to 2.1 that was 1.1 when the SH-4 was devel-
oped, because the advance of the optimization technology of compliers made the
version 1.1 not to reflect the features of real applications with excessive elimination of
unused results in the program [
49
]. The complier advance and the increase of the
optimization difficulty for the version 2.1 were well balanced to maintain the continuity
of the measured performances by using proper optimization level of the compiler.
Figure
3.16
shows the evaluated result of the cycle performance. The improve-
ment from the SH-3 to the SH-4 in the figure was already explained in Sect.
3.1.2.7
.


Search WWH ::

Custom Search