Information Technology Reference
In-Depth Information
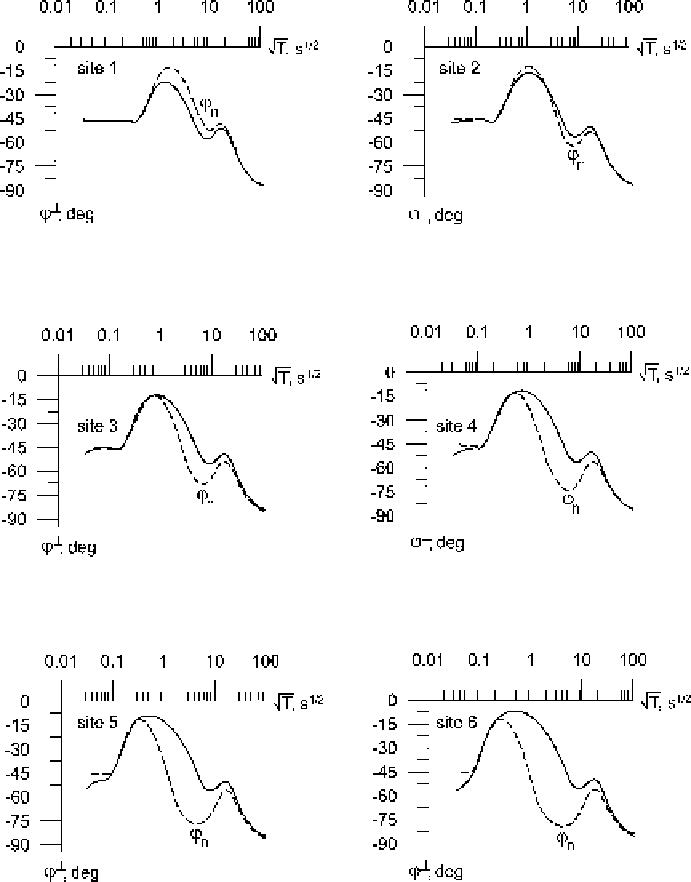
Fig. 11.4
Transverse impedance-phase curves in the model of the
S-
effect shown in Fig. 11.1
effects may differ in manifestation and hence in the correction technique. Consider,
for instance, apparent-resistivity curves in a three-layered model with
2
1
and
3
2
. When correcting the
S
−
effect, we have to correct only the descending
branch of the
−
curves reflecting the depth
h
1
+
h
2
. But in the case of the
−
A
effect, both the ascending and descending branches of the
−
curves reflecting
A
the conductance
S
1
and the depth
h
1
+
h
2
should be corrected. How can we rec-
−
−
−
ognize the
S
and
effects in data? Considering
curves, we can hardly tell
A