Information Technology Reference
In-Depth Information
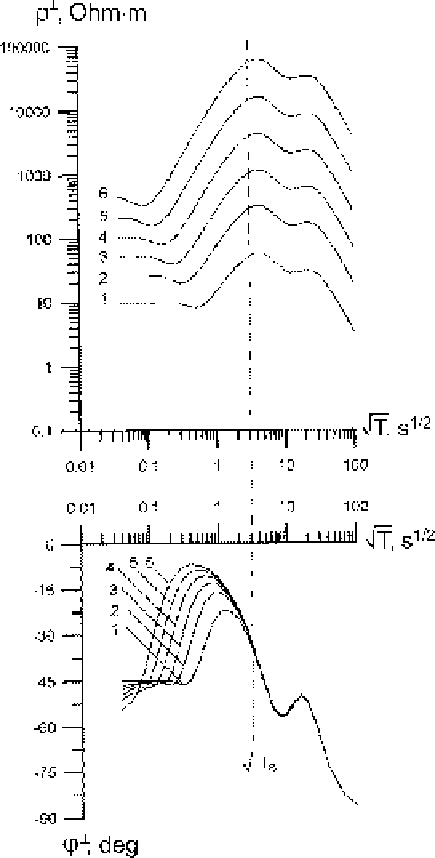
Fig. 11.5
Combined graph of
the transverse
apparent-resistivity and
impedance-phase curves
obtained in the model of the
S-
effect shown in Fig. 11.1
the
S
effect. The impedance-phase curves are more indicative,
since they help to estimate the initial period
T
S
as a period where adjacent phase
curves merge together. So, we can suggest a simple rule for static shift correction.
The
−
effect from the
−
curves should be corrected for the static shift at periods with coincident
phases at the adjacent sites. Other evidences may be found by correlating apparent
resistivities
−
A
with sediments conductance
S
sed
determined from frequency and
transient soundings or resistivity logging. If, for instance, the
−
A
values from the
low-frequency descending branch of apparent-resistiviry curves correlate with the
S
sed
−
−
A
−
values, then we can suppose that they are distorted by the
S
effect. And