Graphics Programs Reference
In-Depth Information
Knowing your images
After a little time viewing the histograms of your images, you will begin to see a pattern
in the way that certain styles of photographs are represented. Overexposed pictures will
display a large grouping of pixels to the right end of the graph, whereas underexposure will
be represented by most pixels bunched to the left. Flat images or those taken on an overcast
day will show all pixels grouped around the middle tones and contrasty pictures will display
many pixels at the pure white and black ends of the spectrum.
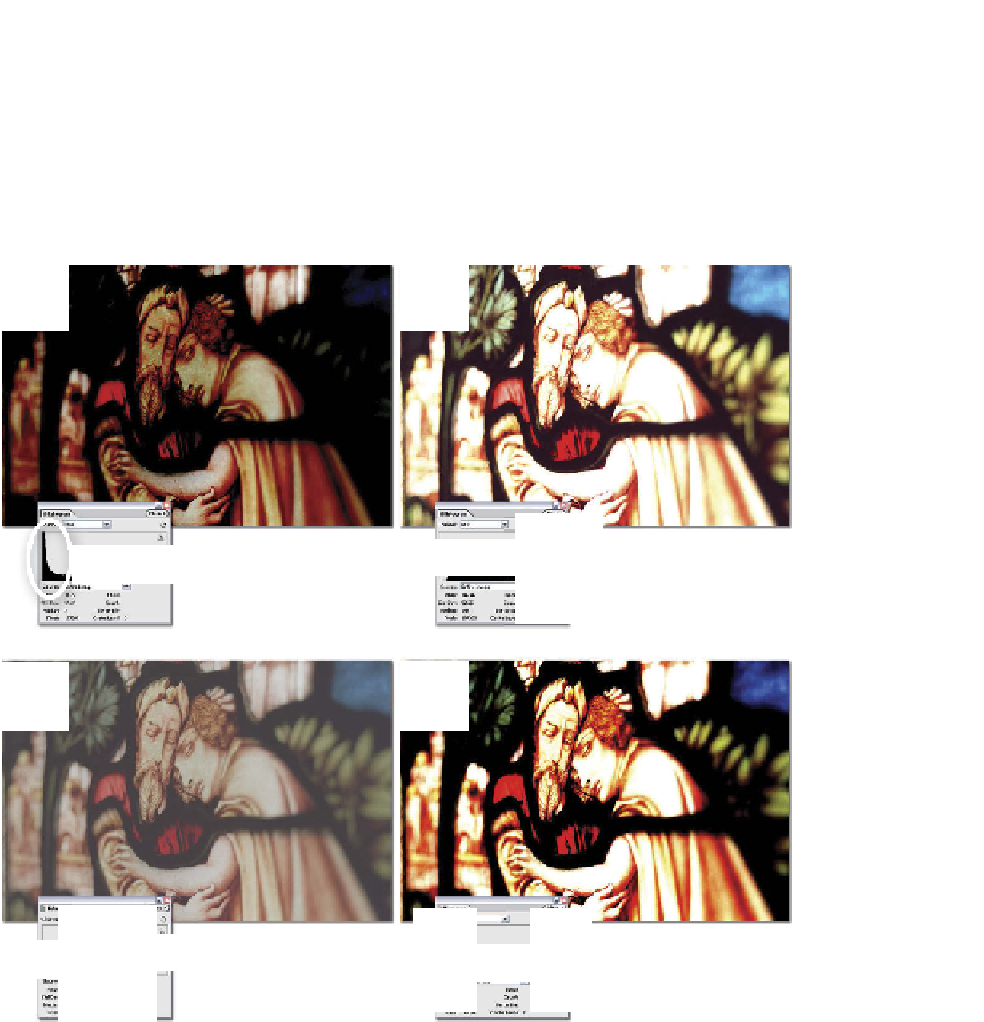
You can diagnose the
problems with your photos
and predict the way that
your picture looks by the
shape of the graph in the
Histogram palette and the
Levels feature.
(1) The pixels are bunched
to the left end of the graph
for underexposed images
and (2) to the right end for
overexposed ones.
(3) Pixels are bunched to-
gether in the middle of the
graph for flat images.
(4) The pixels are spread
right out to the left and
right edges for contrasty
pictures.
1
2
3
4
Previously in this topic we have fixed these tonal problems by applying one of the automatic
correction features, such as Auto Contrast or Auto Levels, or by using a simple slider control
such as Brightness/Contrast. All of these tools remap the pixels so that they sit more evenly
across the whole of the tonal range of the picture. Viewing the Histogram of a corrected
picture will show you how the pixels have been redistributed.


Search WWH ::

Custom Search