Graphics Programs Reference
In-Depth Information
#
Editor: Enhance > Adjust Lighting > Levels
If you want to take more control of the process than is possible with the auto solutions, open
the Levels dialog. Looking very similar to the Histogram, this feature allows you to interact
directly with the pixels in your image. As well as a graph, the dialog contains two slider
bars. The one directly beneath the graph has three triangular controls for black, midtones
and white, and represents the input values of the picture. The slider at the bottom of the box
shows output settings, and contains black and white controls only.
To adjust the pixels, drag the Input Shadow (left end) and Highlight (right end) controls
until they meet the first set of pixels at either end of the graph. When you click OK, the pixels
in the original image are redistributed using the new white and black points. Altering the
Midtone control will change the brightness of the middle values of the image, and moving
the output black and white points will flatten, or decrease, the contrast. Clicking the Auto
button is like selecting Enhance > Auto Levels from the menu bar.
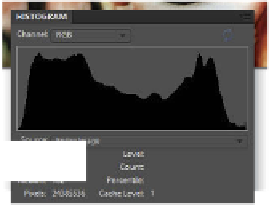
1
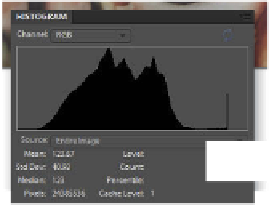
2
Auto Levels:
The Auto Levels or Auto
Contrast feature
redistributes pixels in the
graph between the black
and white points.
(1) Before Auto Levels.
(2) After Auto Levels.
Pegging black and white points
On the right-hand side of the Levels dialog is a set of three Eyedropper buttons used for sam-
pling the black, gray and white pixels in your image. Designed to give you ultimate control
over the tones in your image, these tools are best used in conjunction with the Info palette
(Window > Info).
To use this technique, start by making sure that the Info palette is visible (Window > Info)
and then select the black point eyedropper from the Levels dialog. Locate the darkest point
in the picture by moving the dropper cursor over your image and watching the values in
the Info palette. Your aim is to find the pixels with RGB values as close to 0 as possible. By
clicking on the darkest area you will automatically set this point as black in your graph (and
your picture). Next, select the white point eyedropper, locate the highest value and again


Search WWH ::

Custom Search