Biomedical Engineering Reference
In-Depth Information
one radian (see
Section 4.3
)
. he Zernike charts of the mouse oocyte showed rather simple symmetry
because of the spherical shape of the cell. Plots of tip and tilt are similar because of the symmetry of the
sample and the fact that the corresponding Zernike polynomials are identical apart from a rotation of
90° about the origin. Note also the similarity between the two astigmatism modes 5 and 6. he Zernike
polynomials for these modes are identical except for a rotation of 45°.
he next sample, a mouse blastocyst specimen, was less symmetric and showed more-complex pat-
terns within the extracted the Zernike modes. Several cavities illed with liquids of a diferent refractive
index are typical for this kind of specimen.
Figure 4.7
shows a bright ield image of this sample where
the focus is adjusted to the middle of the specimen. he scanning process is indicated as well. Pseudo-
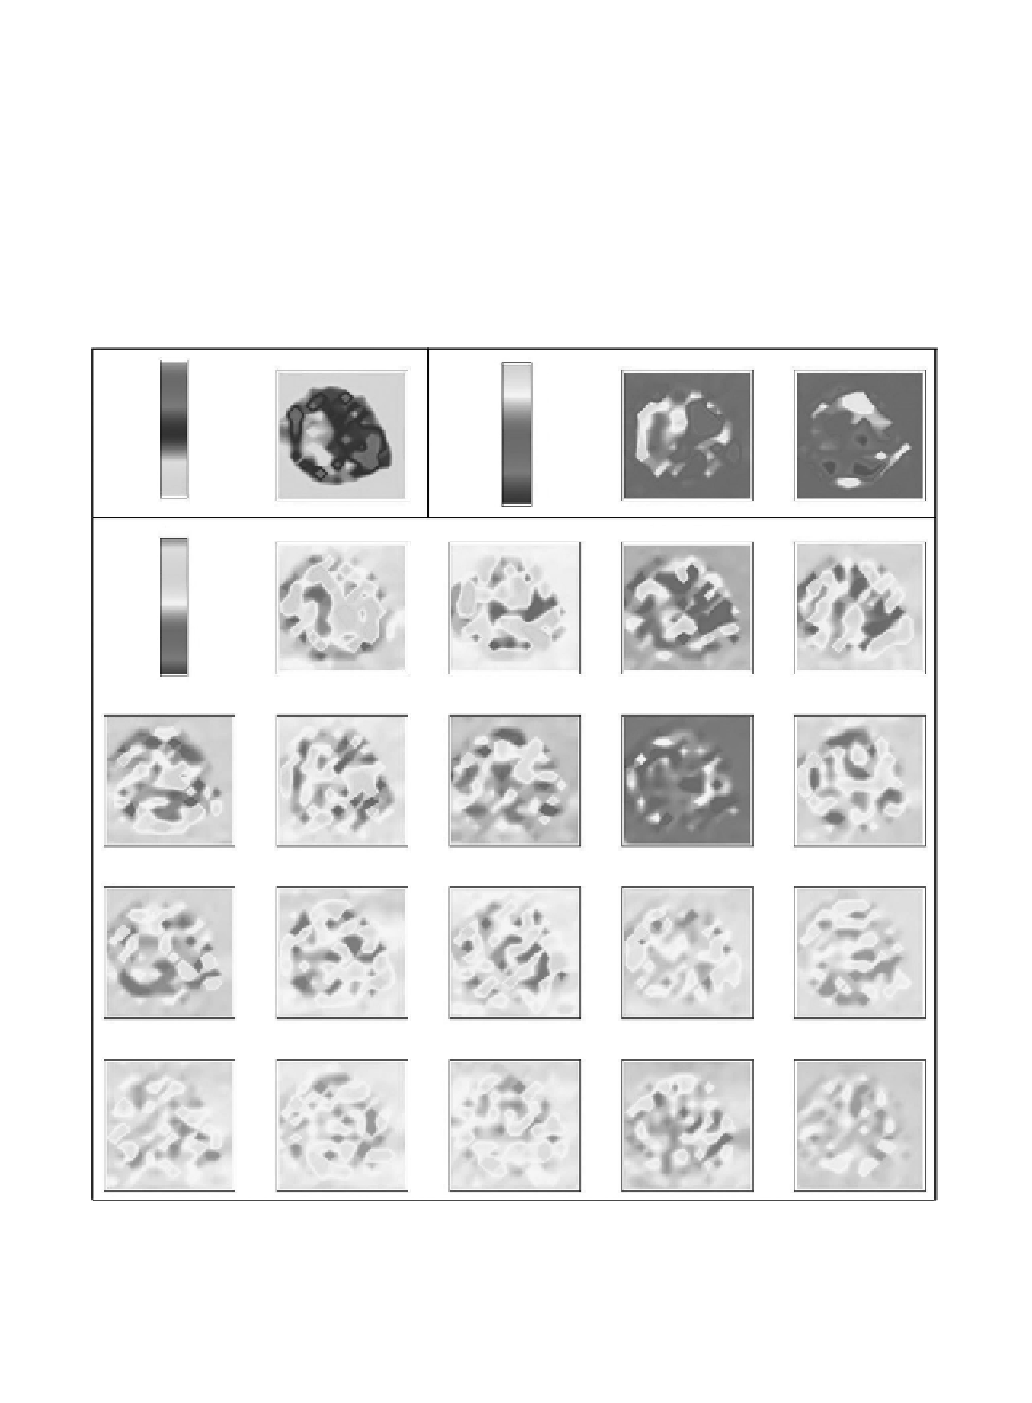
images for the sum of the static and ield-dependent components of the Zernike modes 2 through 22 of
the blastocyst sample are shown in Figure 4.11. Mean and standard deviation are shown in the middle
2
Total Zernike
Mode 2—Tip
Mode 3—Tilt
1
0.5
0
‒
0.5
‒
1
1
0
Mode 4—Defocus
Mode 5—Astigmatism
Mode 6—Astigmatism
Mode 7—Coma
1
0.5
0
‒
0.5
‒
1
Mode 8—Coma
Mode 9
Mode 10
Mode 11—Spherical (1st)
Mode 12
Mode 13
Mode 14
Mode 15
Mode 16
Mode 17
Mode 18
Mode 19
Mode 20
Mode 21
Mode 22—Spherical (2nd)
Figure 4.11
Zernike mode plots for the coeicients 2-22 of the mouse blastocyst sample. For these images, 256
wavefronts were recorded and the Zernike modal content was extracted as described in the text. Objective lens:
Zeiss Plan-Neoluar 20×, 0.5 NA, dry lens. Condenser lens: Zeiss LD-Achroplan, 40×, 0.6 NA, correction ring. he
scanned area was 130 × 130 μm (see
Figure 4.7
)
.