Biomedical Engineering Reference
In-Depth Information
inset of
Figure 4.13
. Note that again the variation of the coeicients declines with increasing order of
the successive Zernike modes. As with the previous sample, coeicient 11 (spherical) shows a signiicant
ofset, as expected. For both the mouse specimens, the objective lens Zeiss Plan-Neoluar 20×, 0.5 NA
was used. his dry lens does not have a coverslip correction, but the correction ring of the condenser
lens was adjusted during the calibration. herefore, the additional spherical aberration introduced by
the coverslip of the sample was compensated. Only the spherical aberration originating from the liquid
layer of the specimen was added to the total aberration measured.
For the last sample, a
C. elegans
specimen of cylindrical shape, the experimental conditions were
slightly diferent: an Olympus 20×, UPlanApo, 0.8 NA, oil immersion was used as the objective lens, and
a one-step calibration in respect to the reference wavefront 2 within the specimen slide was carried out.
his means that the aberration data shown in Figure 4.12 and the bottom inset of
Figure 4.13
contain
the ield-dependent fraction of the specimen-induced aberration only; the static part caused by focusing
Total Zernike
Mode 2—Tip
Mode 3—Tilt
1
1
0.75
0.5
0.75
0
0.25
‒
0.5
0
‒
1
Mode 5—Astigmatism
Mode 6—Astigmatism
Mode 7—Coma
Mode 4—Defocus
1
0.5
0
‒
0.5
‒
0
Mode 8—Coma
Mode 9
Mode 10
Mode 11—Spherical (1st)
Mode 12
Mode 13
Mode 14
Mode 15
Mode 16
Mode 17
Mode 18
Mode 19
Mode 20
Mode 21
Mode 22—Spherical (2nd)
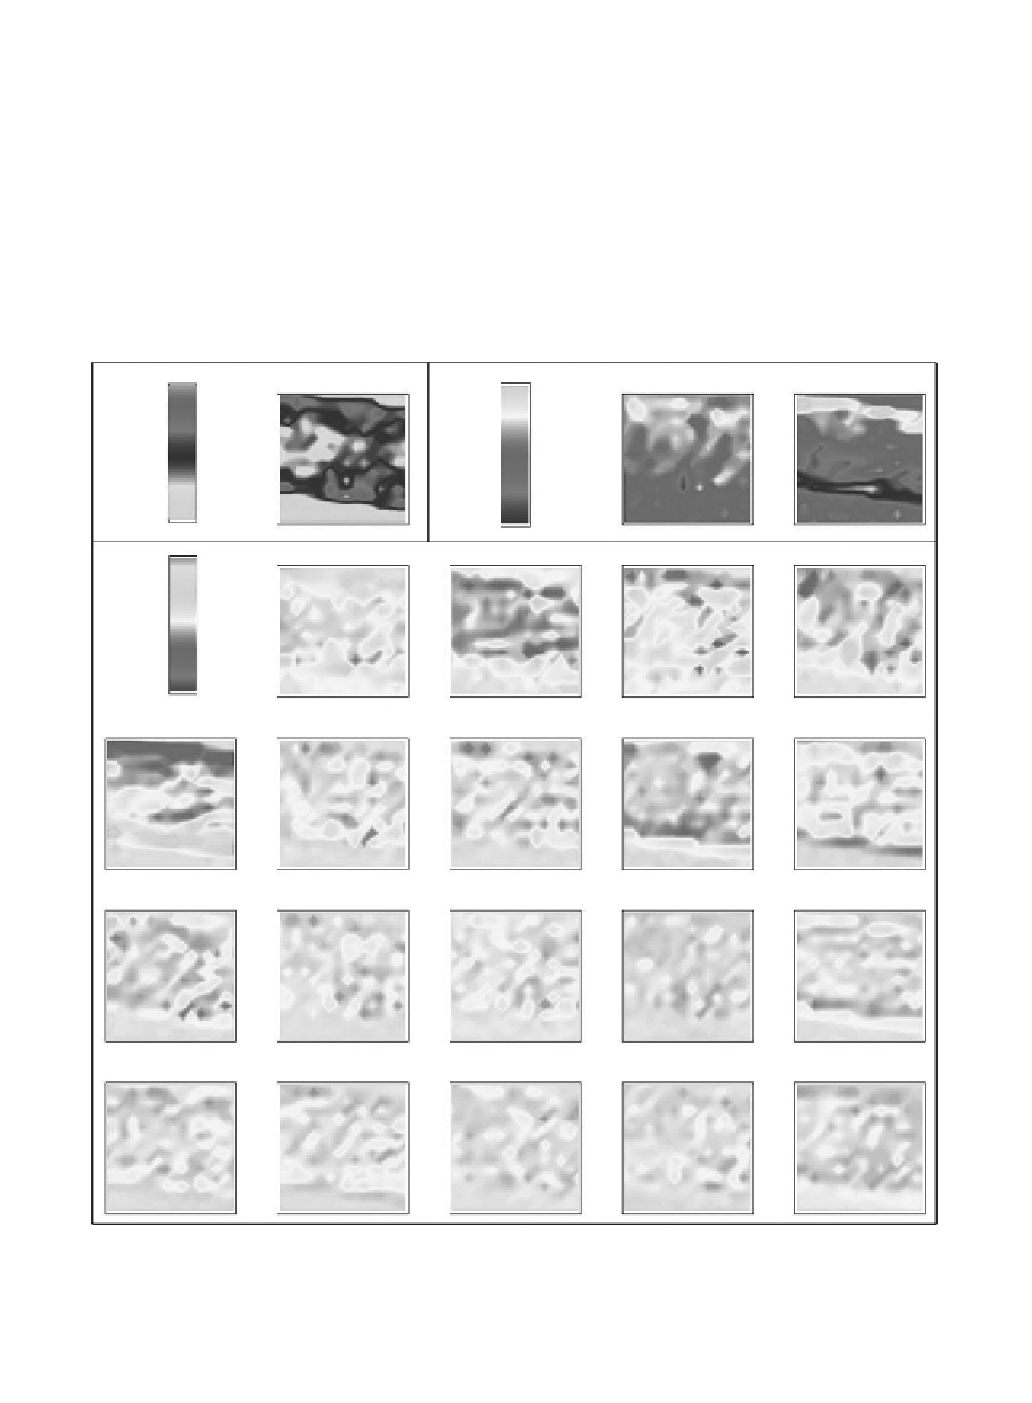
Figure 4.12
Zernike mode plots of the
C. elegans
sample, coeicients 2-22. For these images, the Zernike modal
content was extracted from 256 wavefronts. Objective lens: Olympus 20×, UPlanApo, 0.8 NA, oil immersion.
Condenser lens: Zeiss LD-Achroplan, dry lens, 40×, 0.6 NA, correction ring. he scanned area was 100 × 100 μm.