Biomedical Engineering Reference
In-Depth Information
(a)
(b)
1800
(c)
1600
1400
1200
1000
800
600
400
200
0
5.0
5.5
6.0
6.5
7.0
7.5
8.0
8.5
9.0
Position below coverslip (
μ
m)
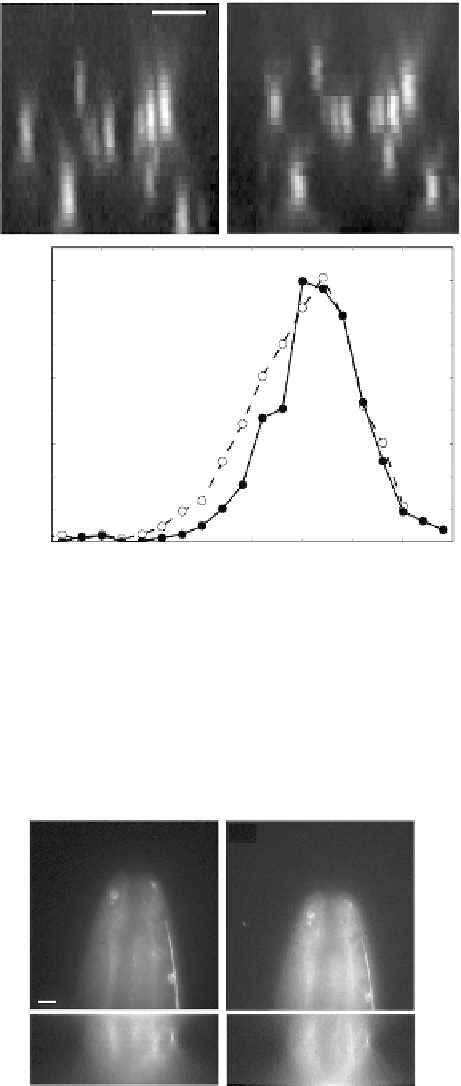
Figure 15.15
GFP-labeled centromeres in eye imaginal discs in
Drosophila
larvae. Scale bar is 2 μm. (a)
Maximum intensity projection of uncorrected three-dimensional data stack. Vertical is the axial direction. he top
of the image is 2 μm below the coverslip, and the bottom is 9 μm below the coverslip. (b) Maximum-intensity pro-
jection of a depth-aberration-corrected data stack. he correction assumed a sample index of 1.38. (c) Line proiles
along the axial direction for uncorrected (dashed line, open circles) and corrected (solid line, solid circles) images
of a GFP-labeled centromere (Kner et al. 2010).
(b)
(a)
Figure 15.16
Comparison of images taken by focusing with the DM (a) and mechanical focusing (b). Images
are of
Caenorhabditis elegans
expressing a GFP sur-5 construct; the bright feature along the right side is the ventral
nerve cord. he top images are taken 6 μm below the coverslip and the bottom images are
xz
-cross sections. he
diference in image intensity is due to photobleaching. Each image is scaled to its maximum intensity. A sample
refractive index of 1.36 was assumed for focusing with the DM using Equation 15.2. he scale bar is 2 μm (Kner
et al. 2010).