Biomedical Engineering Reference
In-Depth Information
he.larger.the.required.wavefront.correction,.the.larger.the.residual.error..So.the.focus.correction.will.
in.general.perform.less.well.than.only.the.depth-aberration.correction..A.focus-tracking.scheme.using.a.
DM.has.been.shown.in.Poland.et.al..(2008a).
15.3.3 Deconvolution
Computational.deconvolution.successfully.removes.out-of-focus.light.by.essentially.reassigning.it.to.its.
source.position.(Agard.and.Sedat.1983).but.requires.accurate.knowledge.of.the.PSF.to.work.optimally..
Most. deconvolution. algorithms. assume. that. the. PSF. is. uniform. throughout. the. sample. and. cannot.
account. for. a. spatially. varying. PSF. because. of. optical. aberrations.. As. mentioned. in.
Section 15.1.2
,
.
deconvolution. with. a. locally. varying. PSF. has. been. implemented. (Kam. et. al.. 2001;. Preza. and.
Conchello 2004),.but.this.approach.is.computationally.intensive..Furthermore,.aberrations.degrade.the.
.signal-to-noise.ratio,.which.will.afect.the.results.of.the.deconvolution.even.if.the.correct.PSF.is.used..
hus,.correcting.depth.aberrations.improves.not.only.the.raw.image.but.also.the.deconvolved.results..
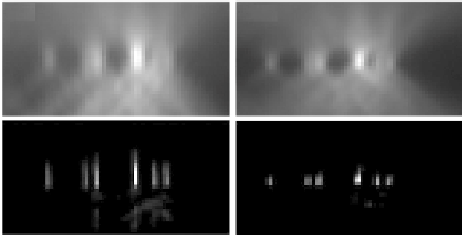
his.is.shown.in.Figure.15.17..Figure.15.17a.shows.a.maximum-intensity.projection.of.the.axial.view.
through.several.200.nm.luorescent.beads.64.μm.below.the.coverslip.in.glycerol..he.depth.aberration.
is.evident.from.the.strong.axial.asymmetry.and.the.elongated.PSF..Figure.15.17b.shows.a.maximum-
intensity.projection.through.the.same.beads.ater.the.depth.aberrations.have.been.corrected.by.the.DM.
using.Equation 15.1..he.PSF.is.now.corrected.and.the.maximum-intensity.from.each.bead.is.a.factor.
of.1.50.higher..Figure 15.17c.and.d.show.the.results.of.deconvolution.on.(a).and.(b).respectively,.using.
a. PSF. measured. at. the. coverslip.. he. deconvolution. of. the. corrected. image. (Figure. 15.17d). shows. a.
signiicantly.smaller.image.of.each.bead.than.that.of.the.uncorrected.image..his.is.true.in.the.lateral.
dimension.(not.shown).as.well.as.in.the.axial.direction.although.the.diference.is.greater.in.the.axial.
direction..he.maximum.intensity.from.a.bead.in.Figure.15.17d.is.a.factor.of.1.85.greater.than.that.in.
Figure.15.17c;.the.correction.of.depth.aberrations.increases.not.only.the.intensity.in.the.raw.images.but.
also.the.efectiveness.of.deconvolution.
Figure. 15.18
. shows. the. deconvolution. of. images. of. actin. labeled. with. Alexa. 488-Phalloidin. in.
B16F10. cells.. he. deconvolved. image. (d). of. the. AO-corrected. data. shows. signiicantly. less. back-
ground.than.that.of.the.uncorrected.data.(b)..Interestingly,.the.images.before.deconvolution.(a).and.
(c).do.not.look.as.diferent..hese.images.are.
xy
-sections.4.4.μm.below.the.coverslip.and.show.actin.
labeling.in.cell-cell.junctions..he.deconvolution.was.performed.using.the.AIDA.sotware.package.
(Hom.et.al..2007).
(a)
(b)
(c)
(d)
FIGuRE 15.17
(a).200.nm.luorescent.beads.in.glycerol.64.μm.below.the.coverslip.imaged.with.no.correction.
by. the. DM.. (b). Same. beads. imaged. with. the. DM. set. to. correct. the. depth. aberration.. (c) Deconvolution. of. the.
image. (a) using. a. PSF. measured. at. the. coverslip.. (d). Deconvolution. of. the. image. (b).. Each. image. is. indepen-
dently.scaled.to.its.maximum.intensity..Each.image.is.6.0.μm.in.the.lateral.dimension.and.6.4.μm.in.the.axial.
dimension.