Biomedical Engineering Reference
In-Depth Information
(a)
(b)
z
1
z
2
THG
THG
z
1
SHG
x
z
2
z
(c)
z
0
(d)
z
0
+ 1.5 µm
z
0
+ 3 µm
xy
THG, SHG
(High-pass filtered, arb. units)
THG
SHG
0
20
40
60
z
(µm)
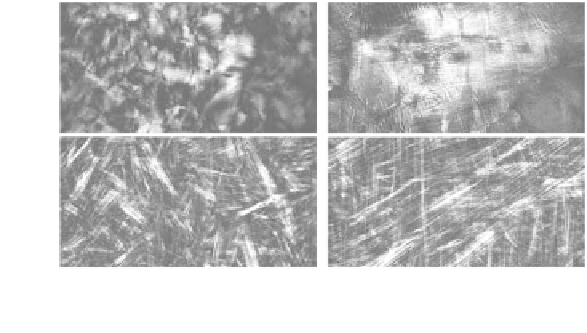
FIgurE 3.18
THG−SHG imaging of the human cornea. Forward-detected THG−SHG imaging of the stromal
organization at different depths. (a)
xz
reprojection of a series of THG images recorded with the epithelium (top)
facing the objective.
NA
= 0.75, scale bars 20 μm (
x
) × 100 μm (
z
). (b)
xy
images recorded at depths indicated in (a).
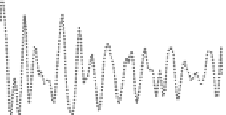
Scale bar 100 μm. (c) THG and SHG images at three different depths illustrating the general anticorrelation of THG
and SHG maxima. (Δ
z
= 1.5 μm) Scale bar = 10 μm. (d)
z
-proiles through THG and SHG image stacks. (Aptel F et al.
2010.
Investigative Ophthalmology & Visual Science
51:2459-2465; Olivier N et al. 2010.
Opt. Express
18:5028-5040.
Reprinted with permission from ARVO and OSA.)
1. In the outermost epithelium, THG images reveal the cellular structures (boundaries and organelles).
In the organized collagen stroma, THG reveals the interfaces between the lamellae, that is, the anisot-
ropy changes that create an effective χ
(3)
heterogeneity. One striking feature of these images is that they
reveal the different large-scale organizations of collagen lamellae at successive depths, as exemplified
in Figure 3.18b. Large-scale (100s of μm) heterogeneity is more pronounced in the anterior stromal
region, whereas the posterior stroma exhibits a more regular, long-range-stacked organization.
2. The corneal SHG signal originates from the collagen fibrils, and depends on the macro-molecular
organization of the collagen. It is maximum in the middle of a layer, where the organization is the
most crystal like. Since individual fibrils are not resolved because of their small diameter (35 nm)
and dense packing, SHG images result from interference processes. Forward-SHG images exhibit
striated features that reflect the orientation and distribution of the fibrils (see Figure 3.18b).
Backward-SHG (B-SHG) images result from a shorter coherence length and appear as relatively
uniform or speckle like [24].
3.3.5.3 influence of the Polarization on tHG images
In the epithelium, THG images highlight the cell structures, whereas in the stroma they also reveal the
anisotropy changes between collagen lamellae. These two types of THG signals have different origins
and can be distinguished using polarization.
Figure 3.19 illustrates the influence of the polarization of the excitation in THG microscopy of the
cornea. The THG image recorded with circularly incident polarization specifically detects the stroma