Biomedical Engineering Reference
In-Depth Information
3.2.5 Size effects
We consider the case of a sphere of diameter
d
with a nonlinear susceptibility χ
(3)
= 1 centered at the
focus, and embedded in a medium with the same index of refraction, but a null nonlinear susceptibility.
We note that, because there is no far-field THG signal from an isotropic normally dispersive homoge-
neous medium [4], and because the propagation of the harmonic field is a linear process, it is equivalent
to consider an object with a nonlinear susceptibility
χ
1
( )
embedded in a medium with a nonlinear
susceptibility
χ
2
( )
, or to consider an object with a nonlinear susceptibility
χ
( )
3
( )
3
−
χ
embedded in a
1
2
medium with
χ
0
3
( )
= .
We denote F-THG the harmonic signal detected in the forward direction (
z
> 0) and B-THG the har-
monic signal detected in the backward direction (
z
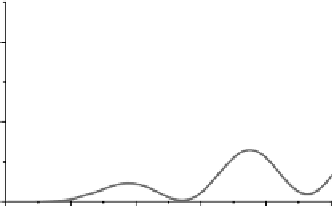
< 0). Figure 3.3 illustrates the dependence of both
F-THG and B-THG signals on the sphere size. As the sphere size increases from zero, both F-THG and
B-THG signals first exhibit a coherent increase characterized by a quadratic intensity dependence on the
sphere volume. Yet, as the size of the sphere further increases, destructive interferences start to occur in
the backward direction, and the signal decreases. This is due to the large phase mismatch in that direc-
tion. The effective coherence length for B-THG can be approximated as
0
π
π
λ
l
BTHG
,
=
≈
≈
(3.13)
c eff
3
k
+
k
6
k
12
n
ω
3
ω
ω
ω
(a)
(b)
0.04
χ
(3)
= 0
χ
(3)
= 1
B-THG
F-THG
F-THG
0.02
B-THG
0.00
0
100
200
300
400
500
d
Sphere diameter
d
(nm)
(c)
(e)
(f)
1.0
B-THG
F-THG
0.5
(d)
d
d
= 1 nm
d
= 100 nm
d
= 10 nm
d
= 150 nm
0.0
d
= 50 nm
d
= 200 nm
0
1000
2000
3000
Sphere diameter
d
(nm)
FIgurE 3.3
THG signal from the center of a sphere as a function of size. (a) Geometry considered. (b,f)
Calculated B-THG and F-THG signal when the excitation beam is focused at the center of a sphere of variable
diameter
d
. Conditions:
NA
= 1.2,
n
ω
=
n
3ω
= 1.33, λ = 1.2 μm. (c,d) Experimental THG images of 600 nm and 3 μm
diameter polystyrene beads. The larger bead appears hollow. Scale bar = 2 μm
, NA
= 0.8, λ = 1.2 μm. (e) Calculated
normalized emission patterns for several sphere sizes. (Reprinted from Débarre D, Olivier N, Beaurepaire E 2007.
Signal epidetection in third-harmonic generation microscopy of turbid media.
Opt. Express
15:8913-8924. With
permission of Optical Society of America.)