Biomedical Engineering Reference
In-Depth Information
Intensity
1
Z
0
2
π
Phase
0
-
π
(Gouy shift)
0
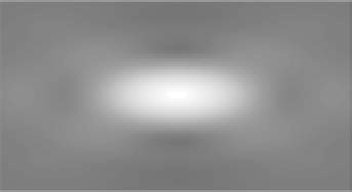
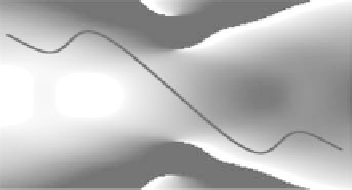
FIgurE 3.2
Intensity and phase distribution of a focused Gaussian beam. 2D distribution of intensity and
phase near the focus. The phase propagation term along direction
z
has been subtracted. −2 μm < ρ < 2 μm
,
−5 μm <
z
< 5 μm, λ = 1.2 μm
.
the same axis. The projection on the propagation axis of the phase difference between the two beams
can then be written as
∆
k
=
k
(
3
ω
)
−
3
( (
k
ω
)
+
k
G
)
(3.11)
where
k
G
represents the Gouy phase shift and is negative. This yields an
effective
coherence length of
π
π
l
FTHG
=
≈
(3.12)
lc eff
,
|
k
(
3
ω
)
−
3
( (
k
ω
)
+
k
) |
| (
3
k
) |
G
G
The right-side approximation in the equation above is valid in the limit of strong focusing. In that
case, the Gouy phase rather than the material dispersion is the dominant factor defining
l
lc eff
,
. This
simple model provides a good estimate of the size of an heterogeneity yielding the maximum signal in
THG microscopy. In the same spirit, we will now use numerical simulations of simple geometries to
dissect the THG process.
FTHG
3.2.4 Green's Function Formulation of coherent Scattering
Throughout the remaining of this chapter, we will use the Green function formalism presented in Ref.
[15]. We here briefly introduce this model (see also Appendix). For details about the numerical imple-
mentation, we refer the reader to Refs. [13,15,16]. The numerical simulation is performed as follows:
1. The focal field at the fundamental wavelength is calculated using Debye−Wolf integrals [13,17,18].
2. The distribution of the induced nonlinear polarization is calculated for a particular sample
geometry.
3. The nonlinear polarization is propagated to the far field using Green's functions.
This model is quite general, and can be used to analyze complex geometries. We will however first
consider simple geometries and discuss the relevant parameters.