Biomedical Engineering Reference
In-Depth Information
which is the value we obtained by considering plane waves. Taking the same parameters as in the
simulation, we find
l
c eff
,
≈ 70nm, which is consistent with the maximum signal value observed. The
B-THG then exhibits damped oscillations with a period corresponding to twice the backward coher-
ence length.
The F-THG signal has a simpler dependence: F-THG increases with bead size until destructive inter-
ference due to the Gouy phase shift (and, if present, to index mismatch between the fundamental and
the harmonic field) becomes significant. F-THG from the sphere center then decreases to zero for large
spheres, which can be considered as a homogeneous medium at the scale of the excitation volume. The
effective forward coherence length can be expressed as
BTHG
π
π
l
FTHG
=
=
(3.14)
c eff
,
∆
k
3
(
k
+
k
)
−
k
ω
g
3
ω
where
k
g
is the linear phase variation induced by the Gouy phase shift. The forward coherence length
was estimated in Ref. [15] as
l
c eff
FTHG
,
≈ 0 7
λ
in the conditions considered here, this value being close to the
.
predicted maximum signal.
There are no visible oscillations on the F-THG signal because the excitation intensity at
z
= 2
,
is
negligible compared to its value at the focus. We note however that in highly dispersive media where
the coherence length (
l
c
= π
c
/3ω(
n
ω
−
n
3ω
)) is smaller than the Rayleigh range of the excitation beam,
oscillations would be present in the forward direction.
l
c eff
FTHG
3.2.6 influence of the excitation nA
Owing to the dependence of the effective forward coherence length on the axial extension of the Gouy
shift, the relative THG signal from objects of different sizes depends on the excitation NA. For details
on the influence of the focusing condition in THG microscopy, we refer the reader to Ref. [20]. We only
outline here the NA dependence in the case of spherical objects centered on the focus. The general rule
is quite simple: reducing the NA results in an increased visibility of large structures relative to small
structures. Changing the excitation NA therefore results in changes of the relative contrast between
structures, as illustrated in Figure 3.4.
This phenomenon can be analyzed simply by considering a paraxial Gaussian excitation beam. The
axial distribution of the Gouy phase shift can then be written as
arctan
(
z
/
b
), where
b
is the confocal
(a)
(b)
(c)
(d)
1.0
THG
0.5
NA
0.8
1.0
1.2
d
0.0
0
1000
2000
3000
NA
= 0.75
NA
= 1.2
Sphere diameter
d
(nm)
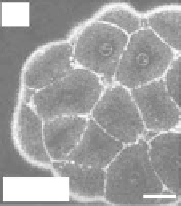
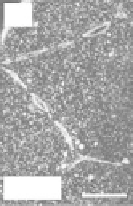
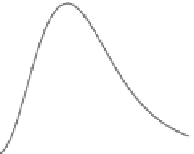
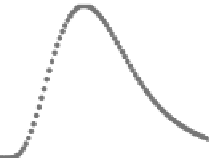
FIgurE 3.4
THG signal as a function of the NA. (a) Centered sphere geometry. (b) Calculated THG from a
centered sphere as a function of size, for three different excitation NAs. (c,d) THG images of cells in a zebrafish
embryo at cleavage stage recorded using
NA
= 0.75 and
NA
= 1.2. Scale bars: 50 μm (c), 30 μm (d). (From Olivier
N et al. 2010. Cell lineage reconstruction of early zebrafish embryos using label-free nonlinear microscopy.
Science
329:967-971. Reprinted with permission of AAAS.)