Biomedical Engineering Reference
In-Depth Information
However, in a separate quantitative SHG imaging with both forward- and backward-detected signals
from native murine tendon [6], we observed only decreased SHG intensity and threefold tissue swell-
ing, but no adverse effects on fibril morphology in both forward and backward channels. Swelling of
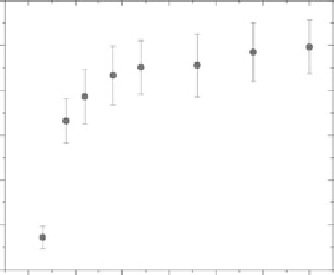
the tendon over a course of 5-h clearing with 50% glycerol is shown in
x
-
z
projections and in a plot of
cross-sectional area increase with time (Figure 8.7). It must be noted that in such experiments, a sample
is restricted between a glass slide and a coverslip; so, the swelling is limited and will be different
in vivo
depending on tissue mechanical properties as well. The decrease of SHG intensity in individual optical
sections is caused by increase in interfibrillar spacing and thus, lower concentration of SHG-producing
dipoles. Interestingly, the overall SHG intensity integrated over the entire cross section of the swollen
tissue is in fact two times higher than that in the control sample. This suggests the retention of morpho-
logical structure through the clearing process, while the overall higher SHG intensity is consistent with
the reduction of scattering. We stress that optical clearing would not be of such an interest for clinical
applications were it not reversible. Fortunately, upon washing in PBS, the tendon loses glycerol and
returns to its original size with no signs of altered morphology (Figure 8.8).
Both optical clearing mechanisms of collagenous structures as described above seem to be coexist-
ing. In fact, partial disruption (or screening) of collagen helices by sugars and sugar alcohols may well
facilitate dehydration and index matching; so, all these processes contribute to the observed optical
clearing. However, the collagen dissociation hypothesis suggested earlier would require complete disap-
pearance of fibrillar morphology observed by SHG imaging. The experimental observation of SHG in
15 min
4 h
(a)
(b)
18
16
14
12
10
8
6
0
50
100
150
200
250
300
Time after immersion (min)
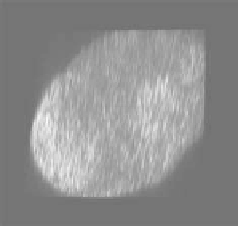
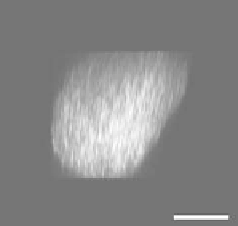
FIgurE 8.7
3-D SHG imaging of 50% glycerol-treated tendon. (a)
x
-
z
projections of the SHG image stacks
for 15 min (left) and 5 h (right) after immersion. Scale = 50 μm. Significant swelling is observed. (b) The result-
ing cross-sectional area over a 5 h time course. The area increases by approximately twofold. (Reproduced from
LaComb, R. et al. 2008.
J. Biomed. Opt.
13:021108.)