Biomedical Engineering Reference
In-Depth Information
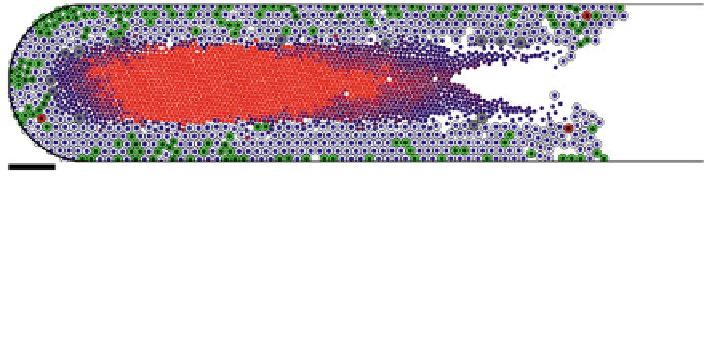
Fig. 8 Patient-calibrated DCIS simulation: After calibrating to a patient's pathology data as in
[
56
], we simulate 45 days of DCIS growth. Legend: Viable rim: The black curve denotes the
basement membrane. The small blue circles are cell nuclei, quiescent cells (
Q
) are pale blue,
proliferating cells (
P
) are green, and apoptosing cells (
A
) are red. Necrotic core: Necrotic cells
(
N
) are grey until they lyse; their solid fraction remains as debris (dark circles in center of duct).
The shade of red indicates the level of calcification; bright red debris are clinically-detectable
microcalcifications (
N
with t [ s
C
). Bar: 100 lm. Adapted with permission from [
56
]
4.2 DCIS Growth is Linear; Mammography and Pathology
Sizes are Linearly Correlated; Origins in Necrotic
Cell Water Loss
In [
56
], we post-processed the simulation in one-hour increments to determine the
mean proliferative index, apoptotic index, viable rim thickness, and density as
functions of time, as well as the farthest viable cell position (x
V
ð
t
Þ
: the virtual
pathology size) and the farthest calcified cell position (x
C
ð
t
Þ
: the virtual mam-
mography size). Open source postprocessing code is given at MathCancer.org. We
plot x
V
(solid blue curve) and x
C
(dashed red curve) in Fig.
9
(left). After early
transient dynamics, a linear (constant-rate) growth pattern emerges. The tumor
advances at approximately 10.2 mm/year (obtained by the linear least-squares fit
of x
V
), whereas the calcification grows at 9.15 mm/year (linear least-squares fit of
x
C
). Due to these linear growth rates, the tumor's mammography and pathology
sizes
were
predicted
to
be
linearly
correlated,
with
a
linear
least-squares
correlation:
pathology size
0
:
4203 mm
þ
1
:
117 mammography size
;
ð
13
Þ
where all measurements are in mm. See the blue points in Fig.
9
(right).
These predictions are qualitatively and quantitatively consistent with clinical
estimates of DCIS growth. Linear DCIS growth has been reported in a clinical
study correlating changes in mammographic size with time between mammograms
[
15
]. Another clinical study on microcalcifications reported that high-grade DCIS
grows at 7.1 mm per year (along an axis to the nipple) [
86
]. They also analyzed the
data in [
15
], deriving 13 and 6.8 mm/year mean and median growth rates,
respectively. According to our relationship in Eq. (
13
), these correspond to
pathology growth rates on the order of 7.6-14.5 mm/year. Hence, both our
mammography and pathology growth rate predictions are quantitatively consistent
with the clinical literature. [
78
] compared the maximum calcification diameter in
Search WWH ::

Custom Search