Biomedical Engineering Reference
In-Depth Information
Tumour
and
m
i
c
r
oca
l
ci
f
ication advance
Pathology S
ize vs. Mammography Size
1400
Simulated DCIS
Clinical data
Maximum tumour extent
Maximum calcification extent
1200
10
2
1000
800
10
1
600
400
10
0
200
0
0
15
30
45
10
0
10
1
10
2
Mammography size (mm)
Time (days)
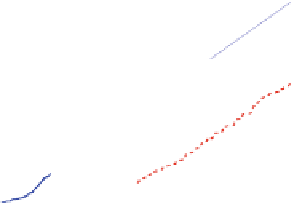
Fig. 9 Left: Over long times, the DCIS advances linearly at approximately 1 cm/year (top
curve); the calcification also grows linearly. Right: The simulation (blue circles) predicts a linear
correlation between the DCIS mammography and pathology sizes. When extrapolated over two
orders of magnitude, the predicted correlation shows good agreement with clinical reports (red
squares). Figures reproduced with permission from [
56
]
mammograms (corresponds to x
C
) with the measured pathologic tumor size
(corresponds to x
V
) in 87 patients, finding a significant linear correlation between
these measurements. When we extrapolate our linear relationship in Eq. (
13
) over
two orders of magnitude (from the 1 mm scale to the 1 and 10 cm scales,
approximating 1-10 years of growth), our extrapolated mammography-pathology
correlation (the curve) shows an excellent quantitative agreement with these 87
data points (red squares) in Fig.
9
(right). This is a surprising and interesting result,
which suggests that absent major alterations in signaling or microenvironmental
factors, a patient's long-time growth dynamics may be established very early in
progression.
These clinical phenomena can be understood as emergent from the underlying
biophysics of the viable rim and necrotic core. Due to oxygen transport limitations,
cell proliferation is confined to an approximately 80 lm viable rim. As the tumor
grows, a steady pattern of flux emerges: proliferating cells towards the tumor
leading edge are directed primarily towards empty space ahead of the tumor.
Farther back, it is more mechanically favorable for mitosing cells to push their
neighbors towards the duct center (against fewer cells) than along the duct (against
more cells). Viable cells get pushed into hypoxic regions of the lumen, where they
become necrotic and accumulate to fill the duct. This results in a linear growth
pattern, as forward-directed proliferative cell flux is constrained to the leading
edge of the tumor.
Necrotic cell lysis sustains this process. Whenever a necrotic cell lyses, its former
volume is converted to a small core of cellular debris and a large pocket of (released)
fluid, which is easily occupied by other cells. Thus, the earlier flux dynamic is
maintained: proliferating cells on the outer edge of the duct push interior cells
towards the necrotic core, diverting much of the overall cell flux inwards rather than


Search WWH ::

Custom Search