Biomedical Engineering Reference
In-Depth Information
1.05
1
0.95
0.9
CE
0.85
CE
SD
0.8
RCE
0.75
SD
0.7
RCE
0.65
−
15
−
10
−
5
0
5
10
15
Z Translation (mm)
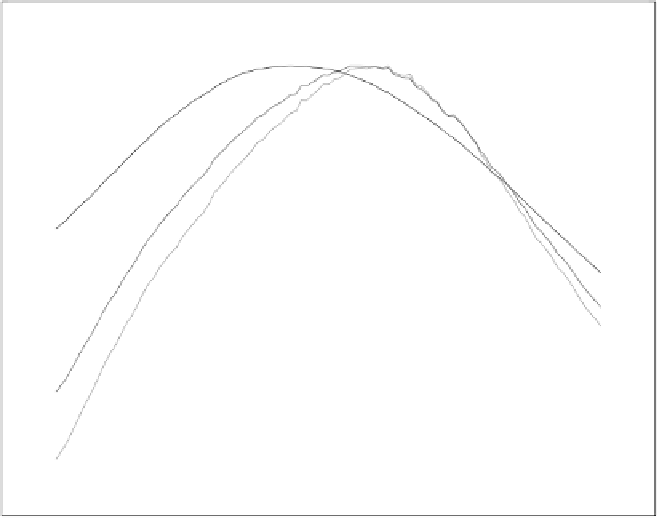
Figure 10.8: The cross-entropy (CE), reversed cross-entropy (RCE), and sym-
metric divergence (SD) profiles of an MR/Em image pair in the vicinity of a
manual registration when the z-translation changes independently.
calculation. We must cope with this numerical instability. A simple, heuristic ap-
proach is described in Section 10.3.6. In this section, the behaviors of different
α
selections are compared. Since the symmetric divergence measure contains the
reversed cross-entropy component, the experiment was only performed using
the reversed cross-entropy measure. One could also ignore the contributions
associated with the zero joint pdfs. As a comparison, this strategy is also
evaluated.
Figures 10.9 and 10.10 show the reversed cross-entropy profiles when the
x
-rotation angle and the
x
-translation change independently. The profiles are
labelled with the
α
values used to compute a small probability value which
replaces the zero pdf. The results when the zero pdfs are ignored in the profile
calculation are also shown.
As these two figures reveal, the reversed cross-entropy profiles are very
rough if the zero pdfs are ignored in the calculation. For the
x
-rotation angle,


