Biomedical Engineering Reference
In-Depth Information
1.05
1
0.95
0.9
0.85
CE
0.8
CE
0.75
SD
0.7
SD
RCE
RCE
0.65
−
15
−
10
−
5
0
5
10
15
Y Translation (mm)
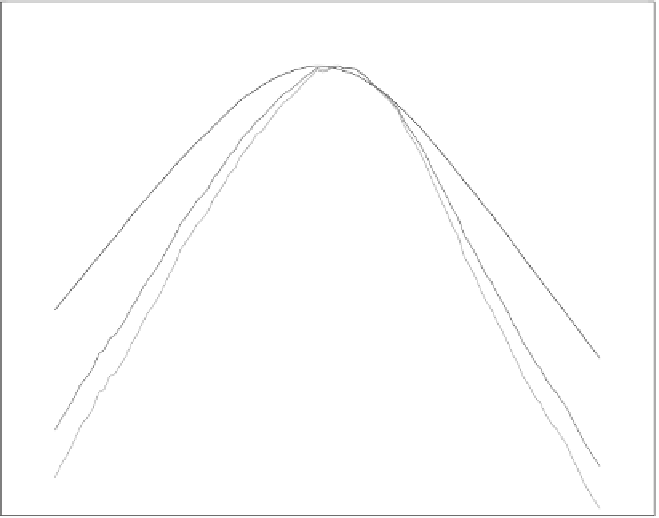
Figure 10.7: The cross-entropy (CE), reversed cross-entropy (RCE), and sym-
metric divergence (SD) profiles of an MR/Em image pair in the vicinity of a
manual registration when the y-translation changes independently.
directions, but sizable in the
z
direction (ca. 4 mm). The cross-entropy curve is
the smoothest.
Although we don't know if the peak appearing in the neighborhood of the
manual registration represents the global optimal, the presence of a local max-
ima does indicate that the three measures are suitable as registration criteria.
The difference in the peak positions is expected since the similarity measures
are different. Furthermore, the Em image used in our study has a low resolution
(7.12 mm in all three directions) and the difference in the peak positions is not
significant compared to the voxel size.
10.5.1.4
Numerical Stability for Maximization
As mentioned earlier, it could cause numerical problems when there are zero
joint probabilities in the reversed cross-entropy and symmetric divergence


