Biomedical Engineering Reference
In-Depth Information
1.05
1
0.95
0.9
0.85
0.8
0.75
CE
CE
0.7
0.65
SD
SD
0.6
RCE
RCE
0.55
−
15
−
10
−
5
0
5
10
1
X Translation (mm)
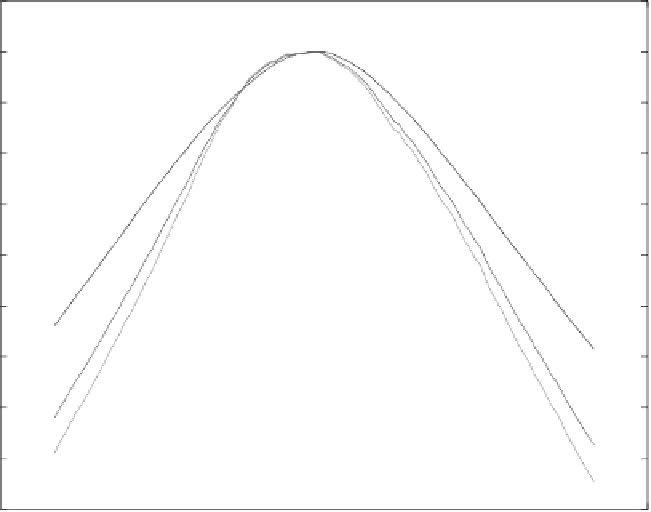
Figure 10.6: The cross-entropy (CE), reversed cross-entropy (RCE), and sym-
metric divergence (SD) profiles of an MR/Em image pair in the vicinity of a
manual registration when the x-translation changes independently.
positions for the different measures which is understandable since they are de-
fined differently. The figures also revealed that the curve for the cross-entropy
measure is slightly smoother than those associated with the reversed cross-
entropy and symmetric divergence measures. This rough nature in the reversed
cross-entropy and symmetric divergence profiles may result in the inferior per-
formance of iterative optimization and a small capture range for these similarity
measures. This behavior may be caused by the presence of many local optima
that can confuse the optimization procedure.
Similarly, Figs. 10.6-10.8 show the representative profiles of the cross-
entropy, reversed cross-entropy, and symmetric divergence measures as a func-
tion of
x
-,
y
-, and
z
-translation, in the neighborhood of a manual registration. All
three profiles peak around the manual registration results. This behavior is one
of the necessary conditions for a good registration measure. The difference of
peak positions of three similarity measures is small (ca. 1 mm) in the
x
and
y


