Biomedical Engineering Reference
In-Depth Information
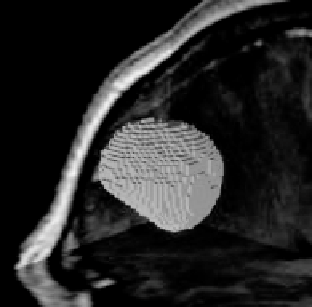
(a)
(b)
Figure 7.8:
(a) The tumor after necessary modifications. This is the final result
in parametric form. (b) Digitization of the tumor. This is the final result in digital
form.
7.3
Results
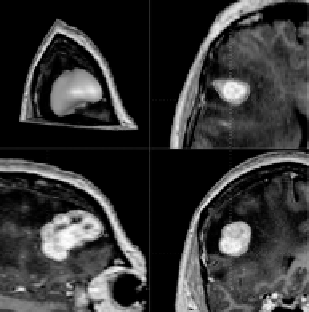
A few examples of image segmentation by the proposed method are shown in
Fig. 7.9. The first column shows the original images, the second column shows
the initial segmentation results, and the third column shows the results after the
necessary revisions. The images represent a short-axis cardiac MR image (first
row), an MR brain image containing a tumor (second row), an MR image con-
taining only the brain (third row), and a PET image of the head (fourth row). The
ventricular blood pool and the brain tumor were initially obtained by a smooth-
ing operation and an optimal intensity thresholding method. In the thresholding
method, first a subvolume including the object of interest is selected. Then the
intensity threshold value that produces the minimum change in the region of
interest as a result of change in threshold value by 1 is determined. The optimal
threshold value is considered to be the intensity where the most stable segmen-
tation is obtained. At the optimal threshold value, a small change in threshold
value will change the segmentation result minimally. This threshold value cor-
responds to the intensity at object boundaries where intensities change sharply.
Therefore, a slight error in estimation of the threshold value will not change the
segmentation result drastically.
The brain image was roughly segmented slice by slice by hand, and the PET
image was segmented by our 3D implementation of the Canny edge detector