Biomedical Engineering Reference
In-Depth Information
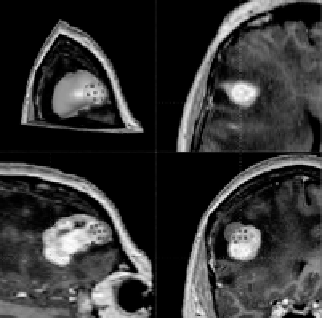
(a)
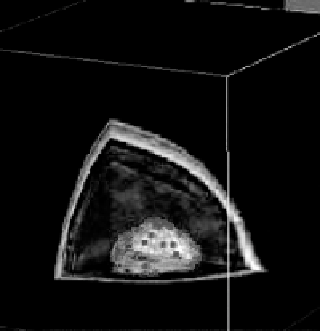
(b)
Figure 7.7: (a) Overlaying of the approximated tumor surface and the volumet-
ric image. The blue dots show the selected control points during surface editing.
The upper-left window shows the 3D view of the image volume with all three or-
thogonal slices. The other three windows show the individual orthogonal views
in axial, sagittal, and coronal directions. (b) Another 3D viewing mode showing
the surface in wireframe form to enable viewing of image information inside
and behind the surface. The red dots show the control points of the surface.
selected by the sphere are then moved with the motion of the mouse. Control
points inside the sphere are not all moved by the same amount and in the same
direction. A point is moved in the appropriate direction by connecting the point
to the center of the sphere and by using the amount proportional to the cosine of
the angle between that direction and the direction of the motion of the mouse.
Only those control points falling inside the hemisphere with positive cosines
are moved. This avoids motion of control points with negative cosines in the
opposing direction. It also ensures that discontinuities will not occur between
points that are moved and points that are not. Intermediate results in surface
modification are shown in Fig. 7.7a. Surface revision can be performed gradually
and repeatedly while observing the image information. The sensitivity of the
surface to the motion of the mouse can be changed by increasing or decreasing
the weights assigned to the control points. To better view the intersection of the
surface with the image planes, the surface can be shown in wireframe form as
depicted in Fig. 7.7b. The edited surface can be digitized as shown in Fig. 7.8b
to create the final segmentation in digital form.