Geology Reference
In-Depth Information
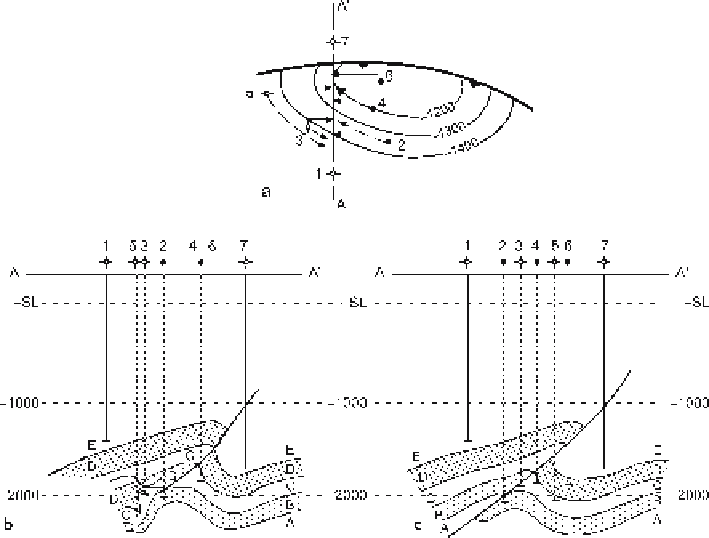
Fig. 6.34.
Different cross sections obtained by different methods of data projection.
a
Structure con-
tour map of horizon
E
, showing the alternative projection directions.
Solid lines
are parallel to the fold
axis;
dashed lines
are parallel to structure contours.
b
Cross section produced by projecting wells along
structure contours.
c
Cross section produced by projecting wells along the plunge of the fold axis.
SL
sea
level. (After Brown 1984)
more than one fault, yet the cross section shows locations where a vertical well should
cut two faults. Projection along plunge (Fig. 6.34c) significantly improves the cross
section. The west half of the structure has a uniform cylindrical plunge to the west and
so projection along plunge produces a reasonable cross section. Only one fault is present
and it is relatively planar, as expected.
Three general approaches to projection will be presented: projection along plunge,
projection with a structure contour map, and projection within dip domains. For struc-
tures where the plunge can be defined from bedding attitude data, projection along
plunge is effective. Where formation tops are relatively abundant, but attitudes are not
available, projection by structure contouring is straightforward and accurate. Com-
puter mapping programs usually take this approach. It must be recognized that the
structure contours themselves are interpretive and may not be correct in detail until
after they have been checked on the cross section. Iterating between maps and the
cross section in order to maintain the appropriate bed thicknesses is a powerful tech-
nique for improving the interpretation of both the maps and the cross section. For dip-
domain style structures, defining the dip-domain (axial-surface) network is an effi-
cient method for projecting the geometry in three dimensions.