Geology Reference
In-Depth Information
Not all features in the same area will necessarily have the same projection direction.
For example, stratigraphic thickness changes may be oblique to the structural trends
and should therefore be projected along a trend different from the structural trend.
Folds and cross-cutting faults may have different projection directions. The respective
trends and plunges should be determined from structure contour maps (Chap. 3), iso-
pach maps (Sect. 4.3.1) and dip-sequence analysis (Chap. 9).
6.6.1
Projection Along Plunge
Projection of information along plunge is most appropriate where the local data are
too sparse to generate a structure contour map, but where the trend and plunge can be
determined from bedding attitudes, for example, from a dipmeter.
6.6.1.1
Projecting a Point or a Well
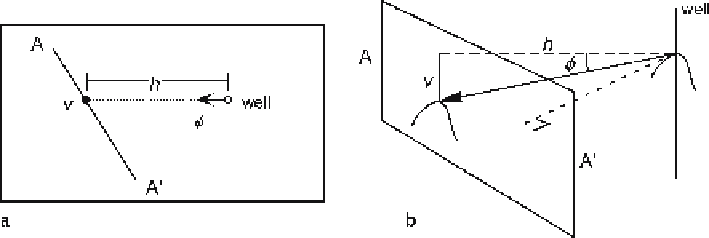
The projection of a point, such as a formation top in a well, along plunge to a new
location, such as a vertical cross section or a seismic line (Fig. 6.35) is done using
v
=
h
tan
φ
,
(6.10)
where
v
= vertical elevation change,
h
= horizontal distance in the direction of plunge
from projection point to the cross section, and
= plunge. For example, if
h
=1 km
and the plunge is 15° (Fig. 6.35), the elevation of the projected point is 268 m lower on
the cross section than in the well.
φ
6.6.1.2
Plunge Lines
Projection along plunge is conveniently done using plunge lines, which are lines in the
plunge direction, inclined at the plunge amount (Wilson 1967; De Paor 1988). Plunge lines
Fig. 6.35.
Projection of a well along plunge to a cross section or seismic profile.
a
Map view of the projection
of the well to cross section
A
-
A'
. The
arrow
gives the plunge direction;
φ
plunge amount;
h
horizontal dis-
tance in direction of plunge from projection point to cross section;
v
vertical elevation change.
b
3-D view