Geology Reference
In-Depth Information
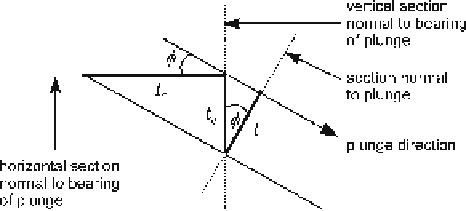
Fig. 6.33.
Vertical exaggeration in cross
section parallel to the plunge
direction, caused by a plunge
angle of
φ
. The true thickness
is
t
; the exaggerated thickness
is
t
h
in the horizontal plane
and
t
v
in the vertical plane
The section is changed from a normal section to a vertical section by exaggerating
the vertical scale with Eq. 6.8. The vertical exaggeration on a vertical section due to the
plunge is removed by multiplying the vertical scale of the section by the reciprocal of
the vertical exaggeration, cos
.
The exaggeration on a horizontal section (map view),
t
h
/
t
, (Fig. 6.33) is
φ
V
e
=
t
h
/
t
=1/sin
φ
.
(6.9)
The exaggeration on a horizontal section due to the plunge is removed by multiply-
ing the vertical scale of the section by the reciprocal of the vertical exaggeration, sin
.
The same procedure can be used to rotate the plane of a cross section around a
vertical axis. Treat Fig. 6.33 as being the map view and the vertical exaggeration as
being a horizontal exaggeration. Equation 6.8 then gives the horizontal exaggeration
of the profile, with
φ
= the angle between the normal to the line of section and the
desired direction of the section normal. Rotate the section by multiplying the horizon-
tal scale by the reciprocal of the horizontal exaggeration, cos
φ
.
φ
6.6
Data Projection
In order to make maximum use of the available information, it is usually necessary to
project data onto the plane of the cross section from elsewhere in the map area. Data from
a zig-zag cross section or seismic line should be projected onto a straight line to correctly
interpret the structure. Wells should be projected onto seismic lines for best stratigraphic
correlation and to confirm the proper depth migration of the seismic data. The additional
data that are obtained by projection from the map to the line of section help constrain the
interpretation of the cross section and help ensure that the interpretation is compatible
with the structure off the line of section. Projection of data to the line of section is an
important step in the geological interpretation, not a simple mechanical process.
Incorrect projection places the data in the wrong relative positions on the cross
section and renders the interpretation incorrect or impossible. The effect of the pro-
jection technique is illustrated with an example (Fig. 6.34) originally presented by Brown
(1984). A cross section of the structure in Fig. 6.34a has been constructed by project-
ing the wells onto the line of section along the strike of the structure contours
(Fig. 6.34b). The resulting profile is poor in terms of structural style. The cross section
shows multiple small faults instead of a single smooth fault. Note that no well shows