Graphics Programs Reference
In-Depth Information
using Surface Analysis
▶
In the context of this category,
surface analysis
refers to the functions that appear
on the Analysis tab of the Surface Properties dialog box. Here you can perform
detailed analyses relating to elevations, slopes, contours, and watersheds (see
Figure 18.5). The results of an analysis are shown graphically in the drawing and,
depending on the type of analysis, can appear as shaded areas, arrows, contours
lines, or even 3D areas—all color-coded for the identification of different ranges of
data. In addition, you can create a legend to help convey the meaning of each color.
Performing an analysis can be thought of as a two-step process. The first step
is to create the analysis ranges in the Surface Properties dialog box. This step
doesn't produce anything visible in the drawing, but it creates the data that will
be used to generate graphical output. To create something visible in the draw-
ing, you must perform the second step, which is to assign a style to the surface
that displays the components of that analysis. For example, to display the slope
arrows for a surface, you must first create the slope ranges and then apply a sur-
face style that has slope arrow display turned on.
A
watershed
is a
discrete area of land
that directs the flow
of runoff to a specific
point or area.
If you haven't already
done so, download
and install the files for
Chapter 18 according to
the instructions in the
Introduction.
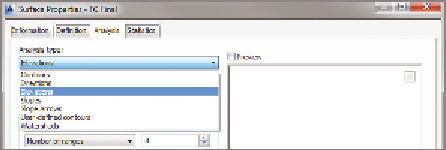
FiGuRE 18.5
The Analysis Type choices available on the
Analysis tab of the Surface Properties dialog box
Exercise 18.2: Analyze Surfaces
▶
In this exercise, you'll perform a slope analysis to identify steep-slope areas in
the project. You'll then adjust one of the lots to demonstrate how an analysis
can be used as a design tool.
▶
1.
Open the drawing named
Analyzing Surfaces.dwg
located in the
Chapter 18
class data folder.
This drawing contains
the FG Final surface
that you created in the
previous exercise.
2.
Click one of the red or blue contours in the drawing, and then click
Surface Properties on the ribbon.
3.
On the Surface Properties dialog, on the Analysis tab, select Slopes as
the analysis type. Under Ranges, enter a value of
4
in the Number field.