Graphics Programs Reference
In-Depth Information
4.
Click the Run Analysis icon (downward-pointing arrow).
Four ranges are listed in the Range Details section of the dialog box.
5.
Edit the slope ranges as follows:
◀
For ID 3, you must enter
the Maximum Slope
value first and then the
Minimum Slope value.
iD
Minimum Slope
Maximum Slope
Colors
1
0.0000%
2.0000%
2
2
2.0000%
10.0000%
3
3
10.0000%
34.0000%
30
4
34.0000%
1158.7766%
1
6.
Click the Information tab, and change the style to Slope Banding (2D).
Click OK, and then press Esc to clear the selection of the surface.
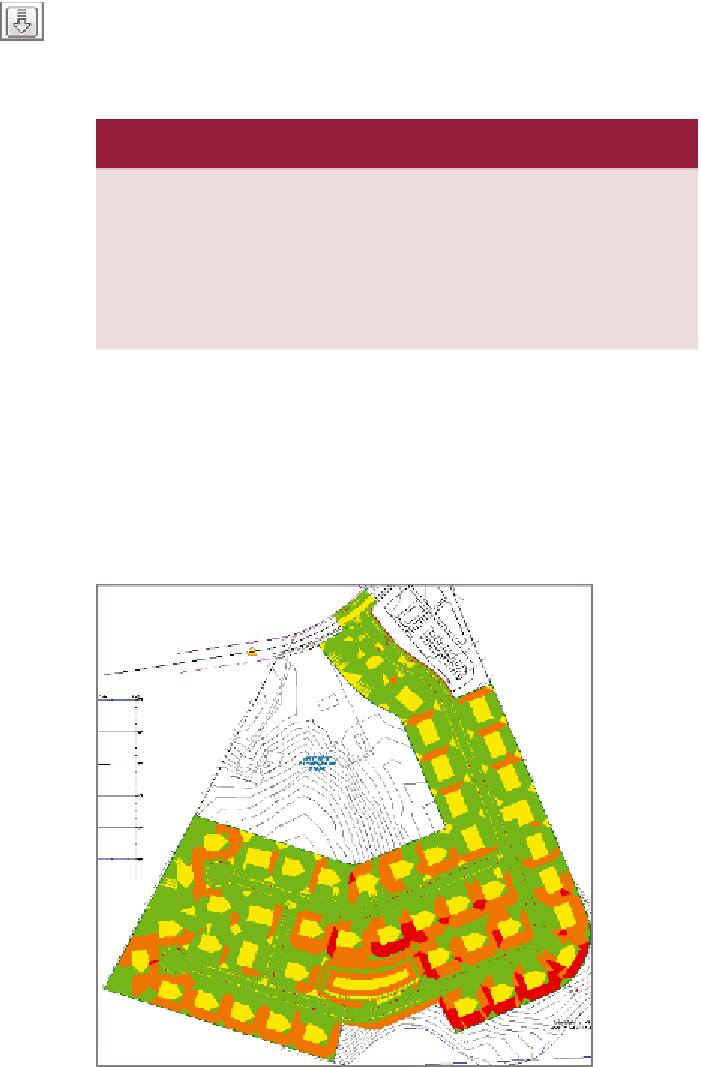
As shown in Figure 18.6, the drawing displays colored areas indicat-
ing excessively flat slopes (0%-2%) in yellow, moderate slopes (2%-
10%) in green, steep slopes (10%-34%) in orange, and excessively steep
slopes (>34%) in red.
◀
The red areas are of
particular concern
because they represent
slopes that aren't
stable with the type of
soil found on this site.
FiGuRE 18.6
Colored areas indicate different slope ranges in
the FG Final surface.