Graphics Reference
In-Depth Information
that are congested (that is, near capacity), potentially necessitating
infrastructure upgrades.
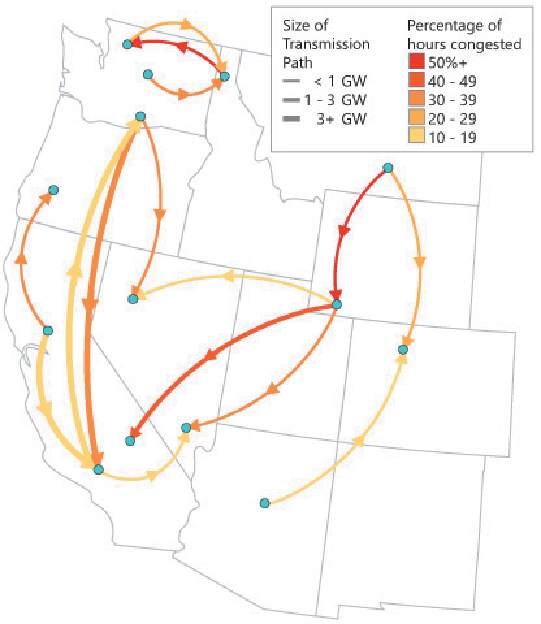
Figure 1-6:
This shows congested transmission lines in the western
United States electrical grid in 2002.
Redrawn based on U.S. Department of Energy National Transmission Grid
Study 2002.
Many of these networks being analyzed in long-term planning must also be
actively monitored to ensure efficient and trouble-free operation. One such
project for us involved real-time data for a natural gas pipeline. In the case
of the pipeline, nodes were compressor stations, and links were pipelines
between each compressor station. Sensors in the compressor stations
collected data such as pressure, flow, how close the compressor is operating