Graphics Reference
In-Depth Information
plants, transport, warehousing, and other infrastructure. Adjustments must
be made as conditions change.
Figure 1-5
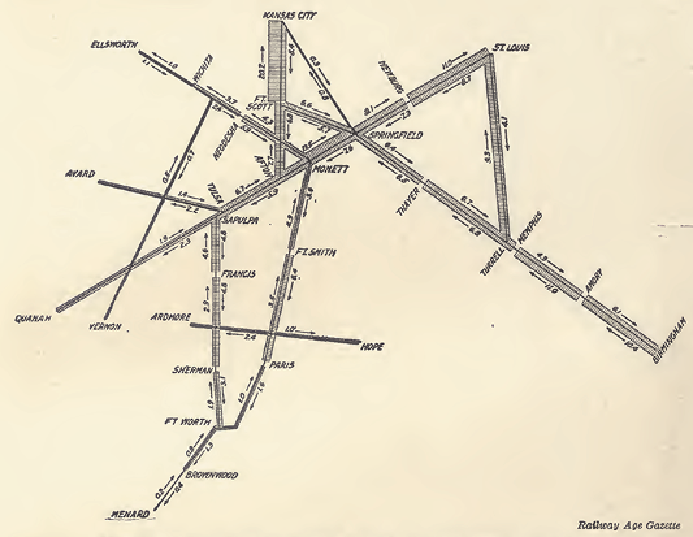
shows an old diagram of freight traffic on a railroad from
1912-13. The thickness of various sections clearly indicates the volume of
traffic, with two sides of each connection indicating the volume of traffic
in either direction. If both sides are equal, then fully loaded box cars are
generating revenue in each direction. Note the imbalance in freight traffic to
and from Kansas City (top) and Ft. Scott shown here.
Figure 1-5:
This graph shows freight traffic density and direction on the
St. Louis and San Francisco Railroad in 1912-13.
Image courtesy Prelinger Library
(
www.prelingerlibrary.org
).
Analyzing physical networks is an ongoing requirement for planners. As
populations and energy use changes, the electrical grid must be adapted,
too.
Figure 1-6
shows a portion of the use of electricity on the West Coast
of the United States from 2002. It shows only electrical transmission lines