Biomedical Engineering Reference
In-Depth Information
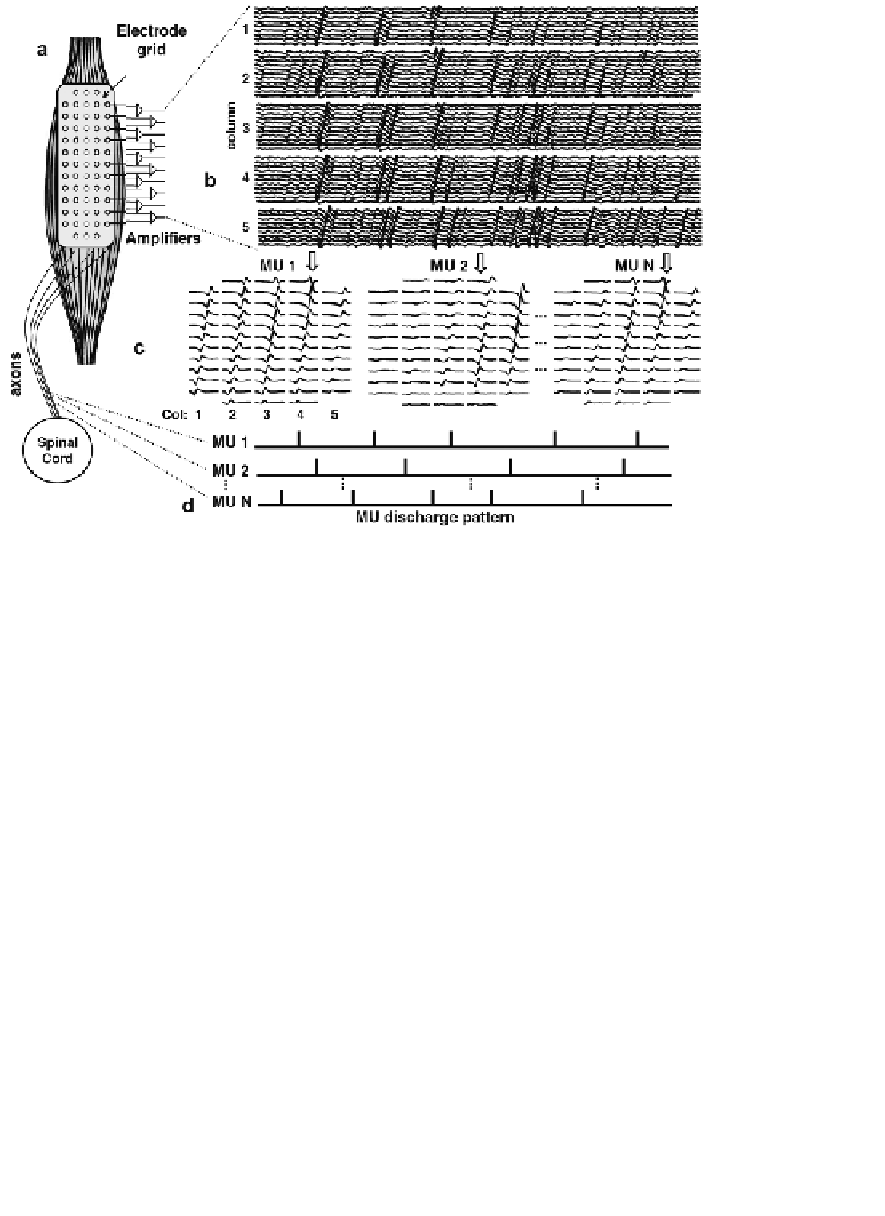
MUAPs is shown in Figure 4.55.
FIGURE 4.55:
Representation of the process of decomposition of multi-channel
surface EMG. (a) Surface EMG was recorded from the biceps brachii muscle with
a13
5 electrode grid (corner electrodes are missing) with the columns parallel
to the fiber direction. (b) Segment of 500 ms duration of bipolar EMG detected by
each column of the grid. The action potentials propagation along the columns may
be noticed. (c) Multi-channel action potentials for three motor units extracted from
the interference signal with the decomposition algorithm described by [Holobar and
Zazula, 2007]. (d) Estimated discharge patterns for the three motor units. From [Mer-
letti et al., 2008].
×
The first step in analysis of sEMG is alleviation of the effect of volume conduction
and suppression of signals from distant sources. This may be achieved by applica-
tion of the Laplacian operator (
Sect. 4.1.3)
.
Spatial high-pass filtering effect may
be achieved also by using bipolar montage [Kleine et al., 2007]. The example of
spatially filtered signals is shown in
Figure 4.56.
The procedure of MUAP identification is similar to these applied in case of sig-
nals recorded by the needle electrodes. It includes setting the threshold for candidate
MUAPs, clustering, creating templates, template matching, decomposition. The se-
rious problem is a small differentiation of the MUAP shapes recorded by sEMG in


Search WWH ::

Custom Search