Information Technology Reference
In-Depth Information
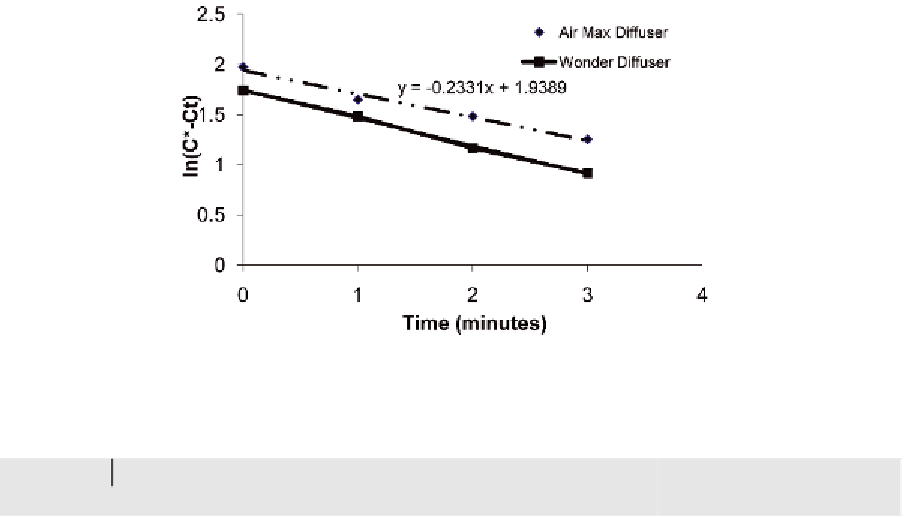
The above equation can be integrated as follows
pet stores. Raw data is available on the website
for K-12 educators. Samples of data analyses
(Davis, M.L., & Cornwell, D.A., 2001) and data
plots are provided below for two diffusers Airmax
and Wonder in Table 2 and Figure 8.
The slope of the lines provides the values of the
gas transfer coefficient. The entire exercise teaches
students many engineering skills. The experiment
is very visual and simple to understand. The data
collection is easy and the analysis exposes students
to integral calculus, data plotting and trendline
fitting using a spreadsheet such as EXCEL.
Ct
t
−
dC
∫
∫
=
K a
−
dt
L
C
*
−
C
Co
o
to obtain ln(C* - C
t
) = ln(C* - C
o
) - K
L
at
Students collect C
t
versus Time (t) data and
plot ln(C* - C
t
) versus time to obtain a linear
line. The slope of this line is equal to K
L
a. The
experiment can be run with various diffusers and
the results can be compared to determine the best
performance. The experiment can be instrumented
by hooking up the DO meter to a computer for
data acquisition. For K-12 educators they can have
students plot the DO versus time profiles with
their students. Students can also evaluate various
air diffusers that can be purchased from common
concLuSIon
The aquarium project generates a lot of enthusiasm
and excitement in our freshman class and K-12
Figure 8. Determining gas transfer coefficients by plotting data
Table 2. Oxygen transfer data analyses
Air Max
Wonder
Air Max
Wonder
Air Max
Wonder
Time (min)
C
t
mg/L
C
t
mg/L
(C* -Ct) mg/L
(C* - Ct) mg/L
ln(C*-Ct)
ln(C*-Ct)
0
2
3.5
7.2
5.7
1.974081
1.740466
1
4
4.8
5.2
4.4
1.648659
1.481605
2
4.8
6
4.4
3.2
1.481605
1.163151
3
5.7
6.7
3.5
2.5
1.252763
0.916291


Search WWH ::

Custom Search