Database Reference
In-Depth Information
Figure 3-19. The Show Missing Values box for histograms
What results is a version of the smaller bin size histogram that I still wouldn't recommend
using, but at least it's accurate.
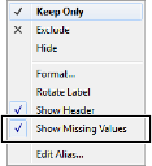
Figure 3-20
now shows the intervals of refuse tonnage that
have no community districts falling into them.
Figure 3-20. Histograms should be shown with missing values
Lastly, I prefer to edit the bar sizes and colors to look more like a histogram made in a stand-
ard statistical graphics tool. Clicking on the
Size
card and moving the slider all the way to the