Database Reference
In-Depth Information
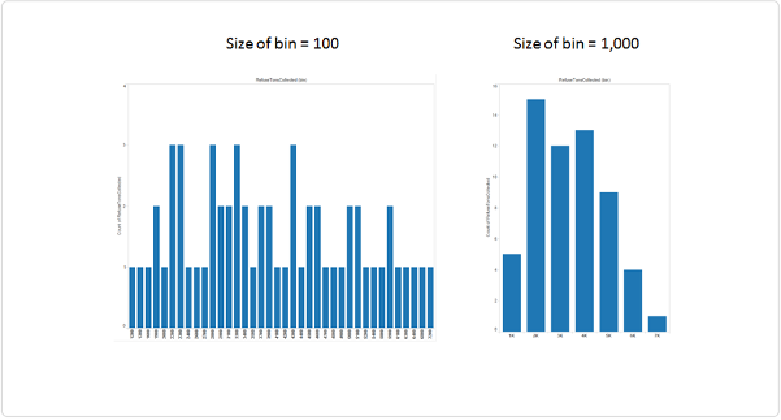
Figure 3-18. Histograms with different bin sizes
It's a case of Goldilocks and the three bears, wouldn't you say?
There's one thing to watch out for with histograms made in Tableau. If you look closely at
the histogram with bins sized at 100 tons, you'll notice that some intervals are missing. The
first bar is for 1,200-1,300 tons and the second is for 1,300-1,400 tons. You'd expect the
third bar to be for 1,400-1,500 tons, but it isn't. It's for 1,600-1,700 tons. Why is this? It's
because there aren't any community districts that produced between 1,400 and 1,500 tons of
refuse. There should still be a column there, but with a bar height of zero. How can we make
this adjustment? Right-click in the bar labels and check the
Show Missing Values
box, as
shown in
Figure 3-19
.