Database Reference
In-Depth Information
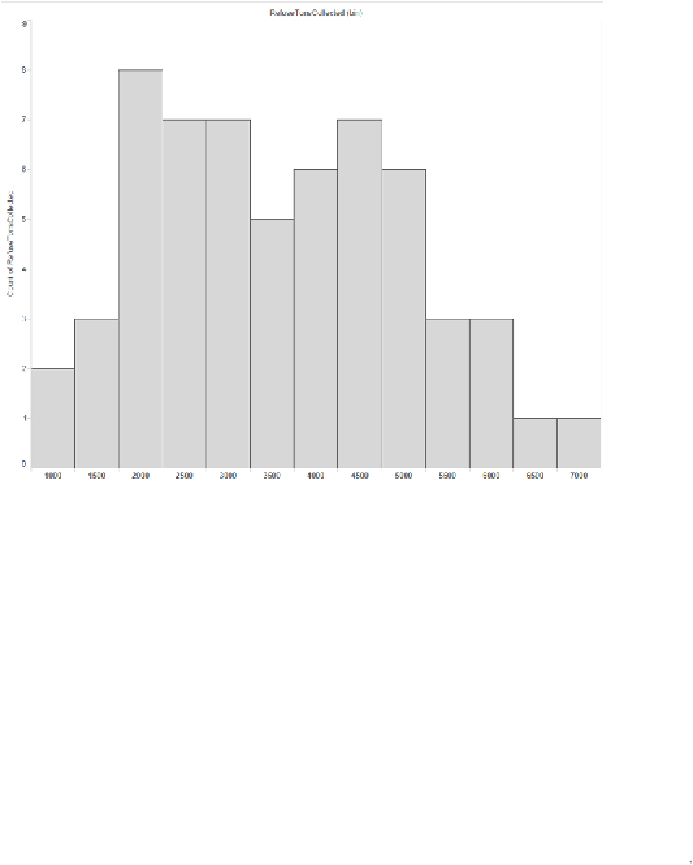
right, changing the color from blue to gray, and adding a dark gray border color yields the
version shown in
Figure 3-21
.
Figure 3-21. A histogram with improved formatting
Summary
How much
and
how many
are foundational types of comparisons that we make every day.
Whenever data is communicated, one of these two comparisons (or both) is being made.
Knowing your options, and evaluating which will work best for the task at hand, is an im-
portant first step in encoding the message.
We've seen how to work with Tableau when communicating the most basic of comparisons:
those in which only one variable is involved. Now, let's move on to explore how to commu-
nicate data when more than one comparison is being made.