Biomedical Engineering Reference
In-Depth Information
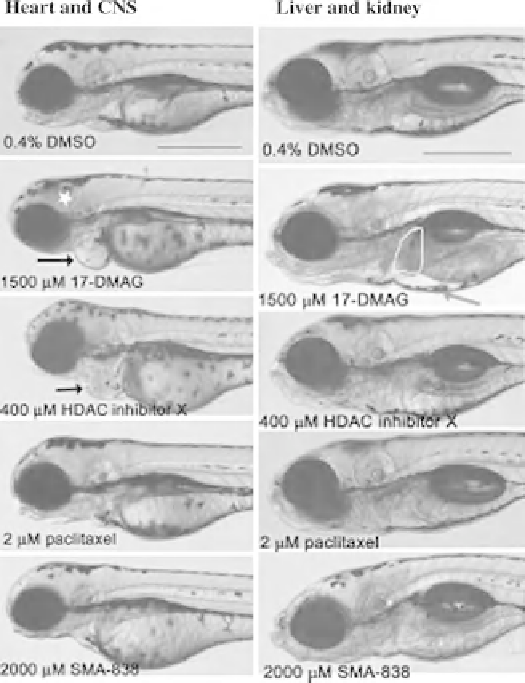
Figure 11.2
Compound-induced toxicity in zebrafish heart, CNS, liver, and kidney after 24 h treatment.
Control- and compound-treated zebrafish at 8magnification. Heart andCNS (left panels 3dpf): 17-DMAG
causedCNS toxicity (white star) and pericardial edema (black arrow). HDAC inhibitor X caused pericardial
edema (black arrow). Paclitaxel and SMA-838 caused no toxicity in heart or CNS. Liver and kidney (right
panels 5dpf): 17-DMAG caused liver hemorrhage (yellow outline) and trunk edema (red arrow). HDAC
inhibitor X and paclitaxel caused no discernable effects. Seventy percent of SMA-838-treated zebrafish
appeared normal. Scale bar ¼0.5mm. (See the color version of this figure in Color Plates section.)
Table 11.4 Organ Toxicity After 24 h Treatment (Concentration)
Compound
Cardiotoxicity
CNS toxicity
Liver toxicity
Kidney toxicity
17-DMAG
þ (1500 mM)
þ (1500 mM)
þ (1500 mM)
þ (1500 mM)
HDAC inhibitor X
þ (400 mM)
Paclitaxel
a
SMA-838
þ
(2000
m
M)
“þ”: toxicity was observed; “”, no toxicity was observed. The value given in parentheses indicates
concentration at which toxicity was initially observed, which was also the highest concentration tested for
each compound.
a
Tested up to 2 mM, the highest soluble concentration.


Search WWH ::

Custom Search