Game Development Reference
In-Depth Information
AnalyzingtheNetBeansIDE8.0GameProjectCPUPro-
filing Tool Results
The NetBeans Profiler essentially looks at
memory usage
and the
CPU time
used to
execute your code. The less memory used, and the faster the CPU times (which equates
to fewer CPU processing cycles required to execute code), the better optimized your
application is. The Profiler also looks at code- (software-) related things, such as meth-
od calls and thread states, which you will be learning about over the course of this
book.
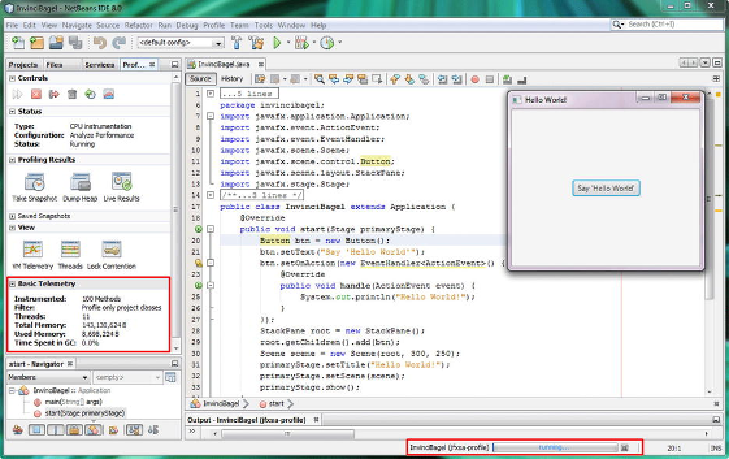
After you run the NetBeans 8.0 Profiler, you will see that a
Profiler
tab has been
added to your Projects, Files, and Services tabs, at the left of the IDE, as illustrated in
Figure 2-17
.
You examined these other three tabs earlier in the chapter (see the section
“NetBeans 8.0 Is Efficient: Organized Project Management Tools”), so let's explore the
Profiler tab now.
Figure 2-17
.
Profile's Basic Telemetry section, at the left of the IDE, under the Profile tab, shows methods, threads,
and total and used memory