Geography Reference
In-Depth Information
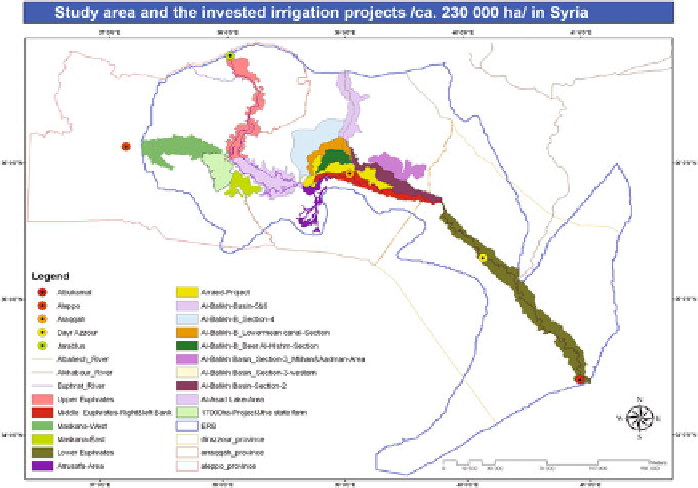
Fig. 5.50 The spatial distribution of the 16-projects in ERB (about 230,000 ha) that generated
from the detailed irrigation projects-schemes and the remotely sensed data (as vector-file)
schemes of each irrigation project that were obtained from the Syrian Ministry of
Irrigation and IGDEP. These schemes represent clearly each project's formative
spatial distribution, but with no geographical reference. These schemes were
linked with the remotely sensed data available using a hard visual interpretation.
The information was also digitized to locate the detailed schemes on the various
existed remote sensing data in order to extract the boundaries of the irrigation
projects. After the maps were on-screen digitized, the borders of the irrigated areas
were evaluated using satellite imagery in many areas. The both shape and size of
the digitized areas were followed by an adjusting process where necessary. Finally,
it was helpful to use publications such as project reports and the frequently pub-
lished statistics about the development in the irrigation areas and the agricultural
plan over the time.
In general, the following steps were adopted: (1) generation of a vector-file that
defined the spatial distribution of the ERB-borders; (2) the register of national
irrigation statistics for the ERB in Syria; (3) geospatial information (detailed
schemes and various remotely sensed data) used to locate irrigated project areas
within the ERB; (4) the production of a detailed vector-based digital map of
irrigated project areas in the ERB (Fig.
5.50
), to be used as a spatial indicator in
combination with the remote sensing data during the agricultural classification
within these projects; and (5) fusion of the digital maps of the irrigated areas in the
ERB for the years 1975, 1987, 2005 and 2007.
Search WWH ::

Custom Search