Geography Reference
In-Depth Information
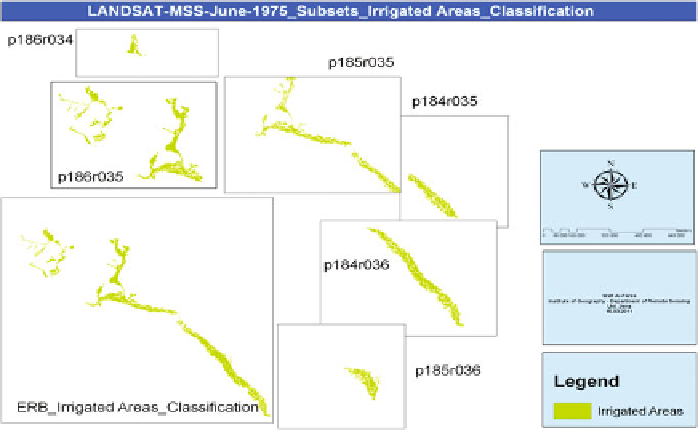
Fig. 5.51 Irrigation mapping in the ERB based on the traditional supervised classification
approach (the first method)
Three methods in mapping the irrigated areas were followed. The first
(Fig.
5.51
) was based on the previous general classes classification results (see
Sect. 5.8
), where the class (cultivated areas) represented the irrigated areas, which
were actually the agricultural areas (planted and fallow). Then, the irrigated areas
vector-file was used to subset and extracts the actual irrigated agriculture within
the projects from the ERB-borders. Here, the classification accuracy was equal to
the gaining general classes accuracy, which was generally high for wide categories
classification. The second method combined the transformed NDVI-values to
vector-file (as mask). The drawback here was that NDVI can only detect the
planted areas and not the fallow-fields. To overcome this problem, the two major
agricultural seasons of winter and summer needed to be classified, where, as, the
non-planted fields during winter would be almost completed planted in summer,
especially in areas with an abundance of water. Then, the two winter and summer
classification results were added into one thematic map that represented the actual
irrigated areas over an individual year. The third method involved the analysis of
each of the 16-projects alone. This was more major for crop classification within
the irrigated areas, mainly when scarce truth-references existed. To this end, the
use of statistical information was helpful. This method is presented in the next
section.
The next task was to define the spatial distribution areas of irrigated agricultural
projects within the natural borders of the ERB in the study's reference time period
of 1975, 1987, 2005 and 2007 by calculating the values of NDVI and making a
mask that covered the spatial prevalence of the projects' areas. This mask was the
Search WWH ::

Custom Search