Hardware Reference
In-Depth Information
Seg_1
Seg_2
Seg_3
Seg_4 Seg_5
Seg_6
Seg_7
Seg_8 Seg_9
N
1
N
3
Metal1
Metal2
Metal3
Metal2
Metal1
N
4
N
2
Fig. 1.24
Segment division according to the FOS model (
Rodrıguez-Monta nes et al.
2007a
)
a
b
1
1
Possible
location B
0.8
Possible
loca
t
ion A
0.8
0.6
0.6
0.4
0.4
0.2
0.2
0
0
0
50
100
150
200
0
100
200
300
400
# segment
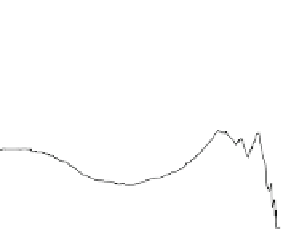
Fig. 1.25
Defective device of a 0:18 m technology containing an open defect (
Rodrıguez-
Monta nes et al.
2007b
)
. (
a
) Prediction of the floating line voltage and (
b
) correlation of the
current-based results
P
N
C
up
i
i DkC1
V
FL
.k; P /
D
V
DD
(1.12)
P
P
N
N
C
up
i
C
C
down
i
i DkC1
i DkC1
The numerator stands for the sum of all neighboring parasitic capacitances tied
to logic 1
C
up i
and located after segment k. The denominator is the sum of all
neighboring parasitic capacitances tied to logic 1
C
up i
and logic 0 .C
down i
/ and
also located after segment k.
This methodology predicts the floating line voltage at the far end of every seg-
ment for every test pattern exciting the open fault (the voltage at intermediate
locations within any segment is found by interpolating the voltage results at their end
points). These predictions were associated with the experimental results obtained on
the tester. The voltage predictions for a real defective device of a 0:18 m technol-
as logic 1 on the tester are plotted in dotted lines, whereas patterns generating a
logic 0 in the floating line are plotted in plain lines. To find a location where the pre-
dicted results are consistent with the experimental results obtained on the tester, the