Geology Reference
In-Depth Information
Latitudinal Gradients in the Andes
South
North
3
2
1
A
Volume Above
Sea Level
Excess
Erosion
4
3
2
1
B
flat-slab
subduction
Average Annual
Precipitation
Moisture Flux
3
100
67
33
C
2
1
Erosion
Intensity
7.5
5.0
2.5
D
50°S
40°S
30°S
20°S
10°S
0°
10°N
Latitude
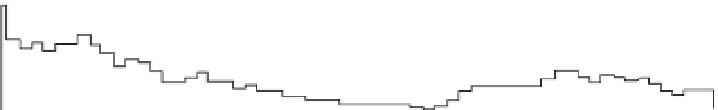
Fig. 10.35
Latitudinal gradients in Andean topography, rainfall, and erosion metrics.
A. Volume of topography above sea level in 1
°
latitudinal bins. B. Excess erosion (see text for explanation).
C. Average annual precipitation and integrated moisture flux - the latter from Bookhagen and Strecker (2008).
These cannot be directly compared because the moisture flux must be divided by area to give a rainfall rate.
D. Erosion intensity index derived from local slope times discharge, calculated as the product of the upstream
drainage area and its average rainfall. Modified after Montgomery
et al
. (2001).
topography and climate (Montgomery
et al
.,
2001) suggests that latitudinal variability is
correlative among several facets of the Andes
(Fig. 10.35). According to this analysis, the
volume of the Andes above sea level is
anticorrelated with annual rainfall: high
preserved volumes of rock occur where rainfall
is low. Assuming that convergence has been
steady over the length of the subduction zone, a
comparable amount of rock is assumed to have
been added per increment of time along each
increment of the Andes. This along-strike
similarity underpins the calculation of an excess
erosion rate that is a function of the volume
deficit within a given 1
(2001) analysis also suggested that differences in
zonal precipitation (easterlies versus westerlies)
shifted drainage divides away from moisture
sources and produced large-scale topographic
asymmetries across the Andes.
One potential drawback of Montgomery
et al
is (2001) analysis is its reliance on local rain
gauges to define precipitation variations. Where
few stations are present, data must be inter-
polated across long distances. When these data
are compared with spatially continuous, but
remotely sensed, rainfall data (Bookhagen and
Strecker, 2008), the integrated moisture flux into
the Andes differs significantly from the pattern
of average annual precipitation (Fig. 10.35).
Whereas part of the difference is because the
flux needs to be divided by area to give a rain-
fall estimate, part is due to very different esti-
mates of the actual amount of rainfall. Such
differences caution against over-reliance on data
from widely scattered weather stations, but also
indicate the need for remotely sensed data to
be well calibrated against measured climate
variables.
bin when compared
with the bin with the largest volume (and
presumably the least erosion). The excess erosion
broadly correlates with rainfall (Fig. 10.35). An
erosion intensity index was derived as a rough
approximation of stream power based on the
average rainfall, upstream drainage area, and
average slope. This index also broadly correlates
with excess erosion and anticorrelates with
volume above sea level. Montgomery
et al
.'s
°