Graphics Programs Reference
In-Depth Information
x 294x1 ...
y 294x1 ...
z 294x1 ...
Grand total is 1111 elements
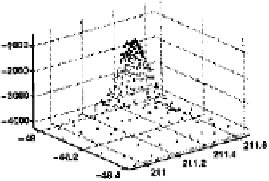
>> plot3(x,y,z,'.')
>> axis tight
Here we have 294 measurements of
x
(latitude),
y
(longitude), and
z
(height above sea level, which is negative). They represent measurements
of a mountain under the sea.
17
The data are stored as column vectors
of
x
,
y
, and
z
values. Suppose we want to plot a surface and a contour
map representing this seamount data. If you try to type
surf(x,y,z)
or
contour(x,y,z)
with this data, you will not get any meaningful plot.
Two ways of generating the desired plots are as follows:
1. Interpolate the data over a rectangular grid.
2. Use triangular gridding instead of rectangular gridding.
Let us look at each of these.
36.1 Interpolation over a Rectangular Grid
We continue the example above and define vectors of uniformly spaced
points between the minimum and maximum values of
x
and
y
:
xiv = linspace(min(x),max(x),50);
yiv = linspace(min(y),max(y),50);
Each of these vectors has 50 elements. We now use the
griddata
inter-
polation function to do two things: (1) create matrices of the
x
and
y
grids that correspond to a rectangular grid over the vectors
xiv
and
yiv
,
and (2) interpolate the data over this new rectangular grid. In the call
to
griddata
that follows, we need to transpose the vector
yiv
because
griddata
expects it to be a column vector in this case:
>> [xi,yi,zi] = griddata(x,y,z,xiv,yiv');
>> whos
Name
Size
Bytes Class
caption
1x229
458 char array
17
The reference can be found by typing the
caption
variable:
>> caption
caption=
Parker, R. L., Shure, L. & Hildebrand, J., "The application of inverse
theory to seamount magnetism", Reviews of Geophysics vol 25, pp 17-40,
1987. x is latitude (degrees), y is longitude (degrees), z is negative
depth (meters).