Graphics Programs Reference
In-Depth Information
x 294x1 2352 double array
xi 50x50 20000 double array
xiv 1x50 400 double array
y 294x1 2352 double array
yi 50x50 20000 double array
yiv 1x50 400 double array
z 294x1 2352 double array
zi 50x50 20000 double array
Grand total is 8711 elements using 68314 bytes
We now have three new matrix variables
xi
,
yi
, and
zi
that correspond
to the interpolated data. We make a plot of the original data and the
interpolated surface:
plot3(x,y,z,'o')
hold on
surf(xi,yi,zi)
colormap(autumn)
axis tight
Where the points of the rectangular interpolation grid lie outside the
convex hull defined by the data, the values are interpolated as
NaN
and
are omitted from the surface plot. There are a variety of ways to do the
interpolation; these are described in the help entry for
griddata
.We
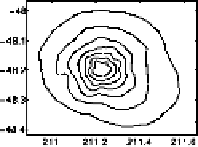
can use the interpolated data to plot a contour map of the seamount:
contour(xi,yi,zi)
36.2 Triangular Gridding
matlab comes equipped with the following functions for use in defining
triangular grids:
griddata delaunay trimesh dsearch
convhull voronoi
trisurf tsearch
The idea is that for any set of points (distinct and with no colinear
subsets) in two dimensions, a set of triangles can be defined such that
(1) no points lie within any triangle's circumcircle and (2) the set com-
pletely covers the convex hull of the points. This idea is illustrated in this