Information Technology Reference
In-Depth Information
(a) (b)
(c) (d)
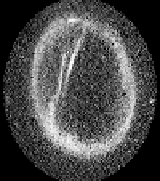
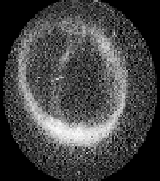
Fig. 6.
Four
Type1
aurora images with transpolar arcs and their edge images
Aurora images with transpolar arcs come in many forms. Three additional aurora
images with transpolar arcs and their edge images which have different hierarchical
representations are shown in Fig. 6 (b), Fig. 6 (c), and Fig. 6 (d). For the image in Fig.
6 (b), the edge image has three closed curves (3 graph nodes, no graph edges) with
two closed curves completely inside the larger outer curve. Similarly, the edge image
in Fig. 6 (c) consists of four closed curves (4 graph nodes, no graph edges) with three
curves located completely within the outer closed curve. In fact, the images in Fig. 6
(b) and Fig. 6 (c) are almost identical. The difference in their edge images is due to
poor segmentation which is not very uncommon and should be expected. Therefore,
two or more curves nested inside an outer curve are also considered as an indication
of the presence of a transpolar arc. Finally, the image may map to one complex closed
curve as shown in Fig. 6 (d). In this case, the presence of a transpolar arc is also de-
tected simply by finding deep concavities. The average of all the slopes of the line
segments forming the concavity can be used as an approximation to the orientation of
the transpolar arc.
4.2 Determination of
Type2
Aurora
Aurora images with thick aurora are of
Type2
. They could contain substorms. The
thickness of the aurora oval is useful in recognizing substorms. The method used for
the determination of the thickness of the oval is given below.
Step 1.
The approximate location of the centroid
C
of the aurora oval is computed by
averaging the coordinates of the starting points of all the line segments.


Search WWH ::

Custom Search