Information Technology Reference
In-Depth Information
Step 2.
In order to determine the thickness associated with the starting point P of a
line segment on the outer boundary of the aurora, the point Q at which line PC
intersects the inner boundary is found. The distance between P and Q is taken as the
thickness of the aurora oval at P.
Step 3.
The values of the thickness associated with the starting points of all line
segments on the outer boundary are determined by repeating Step 2. If the maximum
thickness is greater than a predetermined threshold, then the image is taken as a
Type2
aurora image.
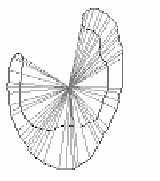
The outer boundary of the edge image of the aurora in Fig. 7 (a) consists of 50 line
segments. The centroid of the oval and all 50 radial lines are shown in Fig.7 (b). The
plot in Fig. 7 (c) shows the thickness of the aurora oval along the boundary.
A
Type2
aurora is an aurora in which a magnetic substorm is possibly present. The
maximum thickness of the oval begins to increase as the substorm begins and intensi-
fies. The maximum thickness of the oval decreases as the substorm subsides. There-
fore, a sequence of
Type2
aurora images could be identified as a substorm by tracking
the maximum thickness of the oval from frame to frame. From the locations at which
the thickness peaks in the oval thickness plots, the location and the movement of the
storm are traced.
(a) (b)
(c)
Fig. 7.
Illustration of the computation of the aurora oval thickness for
Type2
aurora


Search WWH ::

Custom Search