Geoscience Reference
In-Depth Information
W
a
pH
T
8.3
0
5
200
400
600
800
1000
4
8.0
3
7.7
2
2000
3000
4000
5000
0
7.4
1
1820 (A)
1820 (E)
0
5
7.1
8.3
40˚S
0
˚
40
˚
N
80
˚
N
40˚S
0
˚
4
0˚N
80˚N
200
400
600
800
1000
4
8.0
3
7.7
2
2000
3000
4000
5000
7.4
1
2100 (B)
2100 (F)
0
5
7.1
8.3
40˚S
0˚
40
˚
N
80
˚N
40
˚
S
0
˚
40
˚N
80˚N
0
200
400
600
800
1000
4
8.0
3
7.7
2
2000
3000
4000
5000
7.4
1
2300 (C)
2300 (G)
7.1
0
5
40˚S
0˚
40˚N
80
˚N
4
0˚
S
0˚
40˚
N
80
˚
N
8.3
0
200
400
600
800
1000
4
8.0
3
7.7
2
2000
3000
4000
5000
7.4
1
2500 (D)
2500 (H)
0
7.1
40˚S
0˚
40˚N
80˚N
40˚S
0˚
40˚N
80˚N
Latitude
Latitude
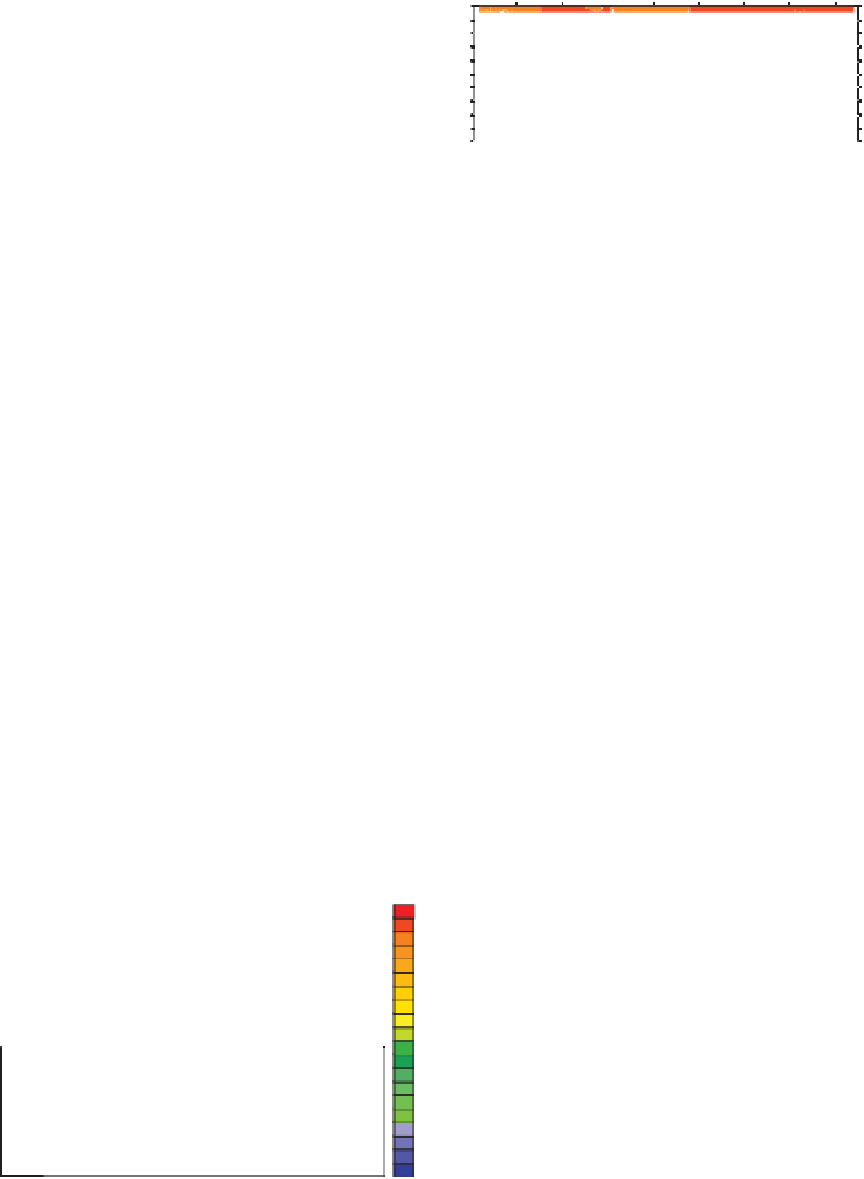
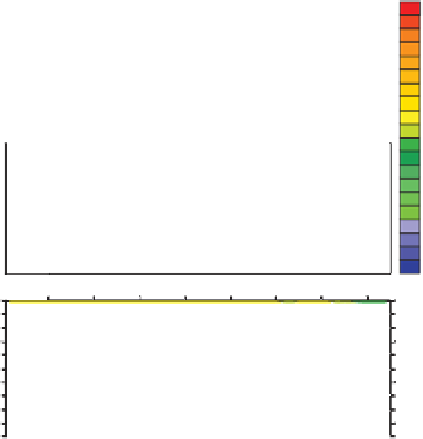
Figure 14.8
Saturation state with respect to aragonite (Ω
a
, left) and total pH (pH
T
, right) in the Atlantic and Arctic Oceans (zonal mean) for the high
'A2_c' commitment scenario by the year 1820 (A, E), 2100 (B, F), 2300 (C, G), and 2500 (D, H). Blue colours in the left panels indicate undersaturation. Note
the different depth scales for the upper and the deep ocean, separated by the white horizontal line.