Geoscience Reference
In-Depth Information
(A)
(B)
5
8.3
8.2
4
Tropical ocean
(shifted by +0.1)
8.1
Tropical ocean
8.0
3
7.9
2
7.8
Southern
Ocean
Southern Ocean
Arctic Ocean
(shifted by -0.1)
7.7
Aragonite saturation
1
7.6
Arctic Ocean
0
7.5
300
400
500
600
700
800
300
400
500
600
700
800
Atmospheric
p
CO
2
(ppm)
Atmospheric
p
CO
2
(ppm)
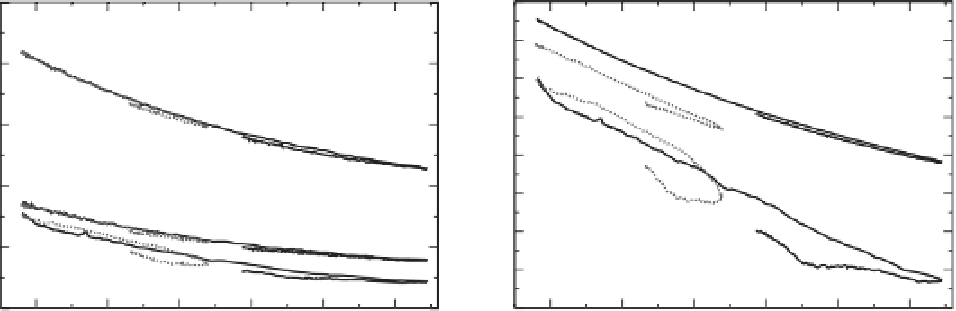
Figure 14.7
Saturation state (Ω
a
) and total pH (pH
T
) in surface water of three regions as a function of atmospheric CO
2
. Results are from the low 'B1_c'
(dashed) and high 'A2_c' (solid) commitment scenarios. The relation between atmospheric CO
2
and saturation state and pH
T
shows almost no path
dependency in the tropical ocean and Southern Ocean. Some path dependency is found in the Arctic Ocean, with lower values in surface saturation and pH
T
for a given CO
2
concentration simulated after the peak in atmospheric CO
2
. Note that the pH
T
-CO
2
curves are shifted by +0.1 pH units for the tropical
region and by -0.1 pH units for the Arctic region for clarity.
the Arctic, in contrast to other regions such as the
Southern Ocean and the low-latitude oceans, where
climate change has almost no effect on the satura-
tion state in our simulations. Climate change ampli-
i es the projected decrease in annual-mean Ω
a
in the
Arctic Ocean by 22% mainly due to surface freshen-
ing in response to the retreat of sea ice, causing local
alkalinity to decrease and the uptake of anthropo-
genic carbon to increase (see also Chapter 3).
In summary, regional changes in the saturation
state and pH
T
of surface waters are distinct. The
largest decrease in pH
T
is simulated in the Arctic
Ocean, where the lowest saturation is also found.
Undersaturation is imminent in Arctic surface water
(Figs 14.6 and 14.7) and remains widespread over
centuries for 21st century carbon emissions of the
order of 1000 Gt C or more.
horizon separating supersaturated from undersat-
urated water rises from a depth between ~2000 and
3000 m all the way up to the surface at high lati-
tudes. The volume of water that is supersaturated
with respect to aragonite strongly decreases with
time. In parallel, the volume of water with low pH
T
expands.
A general decrease in CaCO
3
saturation corre-
sponds to a loss of volume providing habitat for
many species that produce CaCO
3
structures.
Following Steinacher
et al.
( 2009 ), i ve classes of
aragonite saturation levels are dei ned: (1) Ω
a
above 4, considered optimal for the growth of
warm-water corals, (2) Ω
a
of 3 to 4, considered as
adequate for coral growth, (3) Ω
a
of 2 to 3, (4) Ω
a
of
1 to 2, considered marginal to inadequate for coral
growth, though experimental evidence is scarce,
and i nally (5) undersaturated water considered
to be unsuitable for aragonite producers. Figure
14.9 shows the evolution of the ocean volume
occupied by these i ve classes for the three com-
mitment simulations. In the 'A2_c' case, water
masses with saturation above 3 vanish by 2070
(CO
2
~ 630 ppmv). Overall, the volume occupied
by supersaturated water decreases from 40% in
pre-industrial times to 25% in 2100 and 10% in
2300, and the volume of undersaturated water
14.6
Delayed responses in the deep
ocean
Ocean acidii cation also affects the ocean interior as
anthropogenic carbon continues to invade the
ocean. Figure 14.8 displays how the saturation state
and pH
T
changes along the transect from Antarctica,
through the Atlantic Ocean to the North Pole for
the 'A2_c' commitment scenario. The saturation