Geoscience Reference
In-Depth Information
(A)
A2_c
(B)
B1_c
(C)
Hist
100
3 < W
a
< 4
3 < W
a
< 4
3 < W
a
< 4
98
96
2 < W
a
< 3
2 < W
a
< 3
2 < W
a
< 3
94
92
90
1 < W
a
< 2
1 < W
a
< 2
1 < W
a
< 2
60
40
W
a
< 1
W
a
< 1
W
a
< 1
20
0
1900 2000 2100 2200 2300 2400 2500
Year
1900 2000 2100 2200 2300 2400 2500
Ye a r
1900 2000 2100 2200 2300 2400 2500
Ye a r
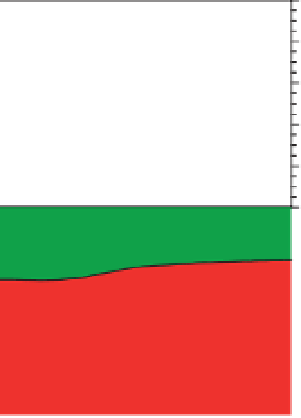
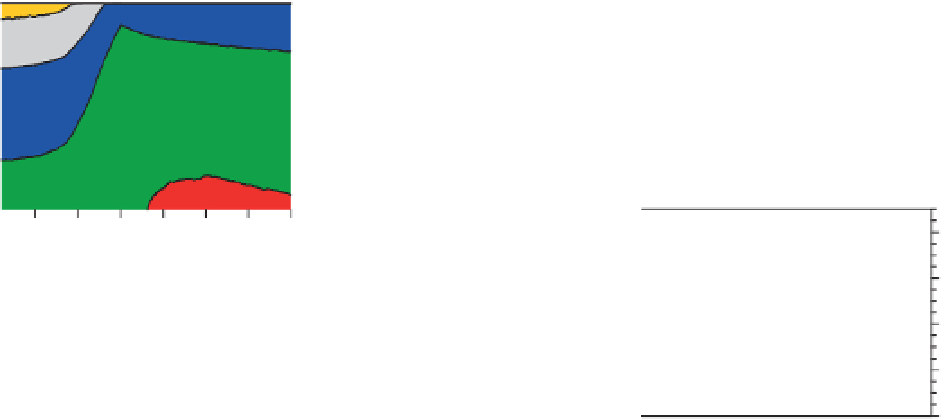
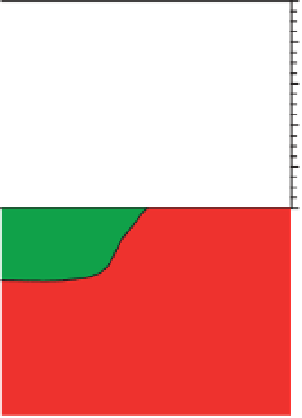
Figure 14.9
Evolution of the volume of water occupied by i ve classes of saturation with respect to aragonite (Ω
a
) for the three illustrative emissions
commitment scenarios. In the high 'A2_c' case and the low 'B1_c' case, 21st century emissions follow the SRES A2 and SRES B1 business-as-usual
scenario, respectively. Emissions are set to zero in both cases after 2100. In the 'Hist' case, emissions are stopped in the year 2000. Note that the y -axis is
stretched above 90%.
increases accordingly. The low 'B1_c' case also
exhibits a large expansion of undersaturated
water from 59 to 83% of ocean volume. In the
'Hist' case, the perturbations in volume fractions
are much more modest and trends are largely
reversed in the well-saturated upper ocean over
the next few centuries.
The response of the saturation state is delayed
in the ocean interior. This delay rel ects the cen-
tennial timescales of the surface-to-deep transport
of the anthropogenic carbon perturbation (Fig.
14.8). In the 'A2_c' case, the volume of undersatu-
rated water reaches its maximum around 2300,
200 years after emissions have been stopped (Fig.
14.9). Even in the 'Hist' case, the volume fraction
of supersaturated water continues to decrease.
The fact that the volume fraction continues to
change signii cantly after 2100 in the 'A2_c' and
'B1_c' cases demonstrates that some impacts of
21st century fossil fuel carbon emissions are
strongly delayed and cause problems for centu-
ries even for the extreme case of an immediate
stop to emissions, i.e. the long-term commitment
is substantial.
14.7 Pathways leading to stabilization
of atmospheric CO
2
In this section, illustrative pathways leading to sta-
bilization in atmospheric CO
2
are discussed in terms
of their implications for projected ocean acidii ca-
tion and carbon emissions from the Bern2.5CC
model (Fig. 14.10). The idea behind prescribing the
CO
2
pathway is to illustrate how anthropogenic
emissions have to develop if atmospheric CO
2
is to
be stabilized as called for by the UNFCCC (UN
1992) and to illustrate the link between changes to
the earth system and CO
2
stabilization levels.
Atmospheric CO
2
is prescribed to stabilize at lev-
els ranging from 350 to 1000 ppmv. This causes
surface-ocean saturation, Ω
a
, to stabilize between
3.3 and 1.7 compared to a pre-industrial mean of
3.7. Surface-ocean pH
T
stabilizes at 8.1 to 7.7 (pre-
industrial 8.2). This corresponds to an increase in
the hydrogen ion concentration of 20 to 300% rela-
tive to pre-industrial times. Global-mean change of
temperature of the surface ocean is between 1°C for
the 350 ppmv stabilization level and 5°C for the
1000 ppmv stabilization level when the climate