Geography Reference
In-Depth Information
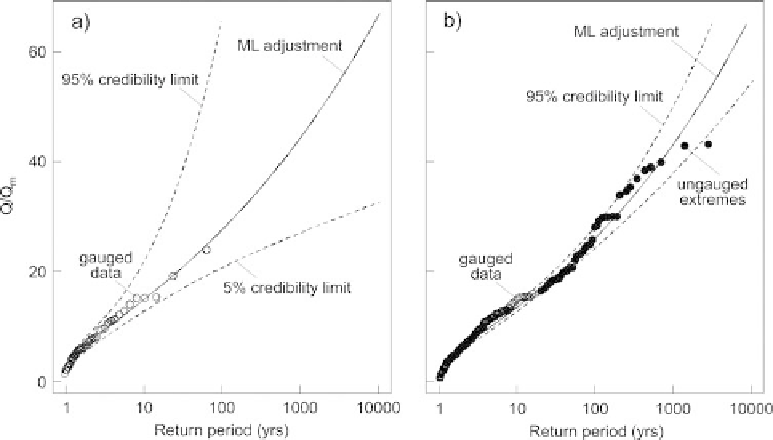
Figure 9.23. Fitted GEV distributions and 90% credible intervals in the Ardèche region, France: (a) data from the St Martin gauging
station on the Ardèche River; (b) including the regional gauged data set and the set of ungauged extremes from post-event surveys.
ML adjustment refers to the Maximum Likelihood estimate. From Gaume et al.(
2010
).
especially severe for events characterised by a small
spatial extent. Overall, these observations point out the
unique role of post-flood surveys in flash flood analysis.
As well as for historic and paleo-floods, the recon-
structed information on flood post-event surveys can be
incorporated in statistical regional flood frequency ana-
lyses. Gaume et al.(
2010
) proposed a method for redu-
cing the uncertainties in estimating regional flood
quantiles using post-event survey data of major flash
floods in ungauged catchments. They applied the method
in Slovakia and the south of France and showed that the
additional information was able to increase the confi-
dence in regional estimation of the growth curve, pro-
vided that the set of ungauged extremes is the result of
comprehensive sampling over the selected region (see
Figure 9.23
).
The use of proxy data and knowledge has been extended
by the flood frequency hydrology framework developed
by Merz and Blöschl (
2008a
,
b
) and Viglione et al.
(
2013a
). They provide a number of examples of local
hydrological effects that cannot be easily captured through
the usual lumped catchment characteristics. To account
for them, additional hydrological interpretation is required
in a
flood frequency in a regional context. In all instances the
aim was not to conduct detailed rainfall
runoff modelling,
but to develop a more detailed interpretation of the regional
flood frequency behaviour. These pieces of information
allowed them to infer whether the floods in the target
catchments were expected to be smaller or larger than the
regional trend, and gave them indications about the shape
of the flood frequency curve. They then provided a number
of suggestions on how these diverse pieces of information
can be combined to come up with flood prediction that
exploits the maximum amount of information about the
flood generating processes in the catchment and region of
interest.
-
9.5 Comparative assessment
The aim of the comparative assessment of flood predictions
in ungauged basins is to learn from the similarities and
differences between catchments in different places, and to
interpret the differences in runoff prediction performance in
terms of the underlying climate
landscape controls. Under-
standing these controls sheds light on the nature of catch-
ments as complex systems and provides guidance on what
methods to choose in a particular environment. The assess-
ment is performed at two levels (see Section 2.4.3). The
Level 1 assessment is a meta-analysis of studies reported in
the literature. The Level 2 assessment involves a more
focused and detailed analysis of individual basins from
selected studies of Level 1 in terms of how the performance
-
analysis. They analysed regional runoff
information not usually used in frequency analysis, such
as the hydrograph shapes, regional flood timing, runoff
coefficients for events of different magnitudes, flood types,
historical photos, inundation maps, precipitation informa-
tion, topographic configuration, landforms, vegetation and
hydrological activity derived from field trips to place the
'
forensic
'
Search WWH ::

Custom Search